35 Repositories
Rust wordcloud-visualization Libraries

Theorem relational dependencies automatic extraction and visualization as a graph for Lean4.
Lean Graph Interactive visualization of dependencies for any theorem/definitions in your Lean project. How to use In your browser: lean-graph.com Or r
A high-performance web-based geospatial visualization tool with an emphasis LEO satellites and lunar missions.
A high-performance web-based geospatial visualization tool with an emphasis LEO satellites and lunar missions. Written in Rust to target WebGPU, with WebGL2 backwards compatibility.
A* Pathfinding Visualisation in Rust
astar.rs A blazingly-fast A-Star search algorithm and visualisation written in Rust. GUI powered by egui. Allows for dynamic grid sizes and user-chose
High-performance Javascript color gradient library powered by Rust + WebAssembly
colorgrad-js High-performance Javascript color gradient library powered by Rust + WebAssembly. No dependencies. Faster than d3-scale, chroma-js, culor

Nodium is an easy-to-use data analysis and automation platform built using Rust, designed to be versatile and modular.
Nodium is an easy-to-use data analysis and automation platform built using Rust, designed to be versatile and modular. Nodium aims to provide a user-friendly visual node-based interface for various tasks.

A free and open-source DNA Sequencing/Visualization software for bioinformatics research.
DNArchery 🧬 A free and open-source cross-platform DNA Sequencing/Visualization Software for bioinformatics research. A toolkit for instantly performi
A Rust library for drawing grid-based user interfaces using ASCII characters.
grux A library for drawing grid-based user interfaces using ASCII characters. // Provides a uniform interface for drawing to a 2D grid. use grux::Grid

Rust library to generate word cloud images from text and images !
wordcloud-rs A Rust library to generate word-clouds from text and images! Example Code use std::collections::HashMap; use std::fs; use lazy_static::la
High-performance time series downsampling algorithms for visualization
tsdownsample 📈 Time series downsampling algorithms for visualization Features ✨ Fast: written in rust with PyO3 bindings leverages optimized argminma

Your one stop CLI for ONNX model analysis.
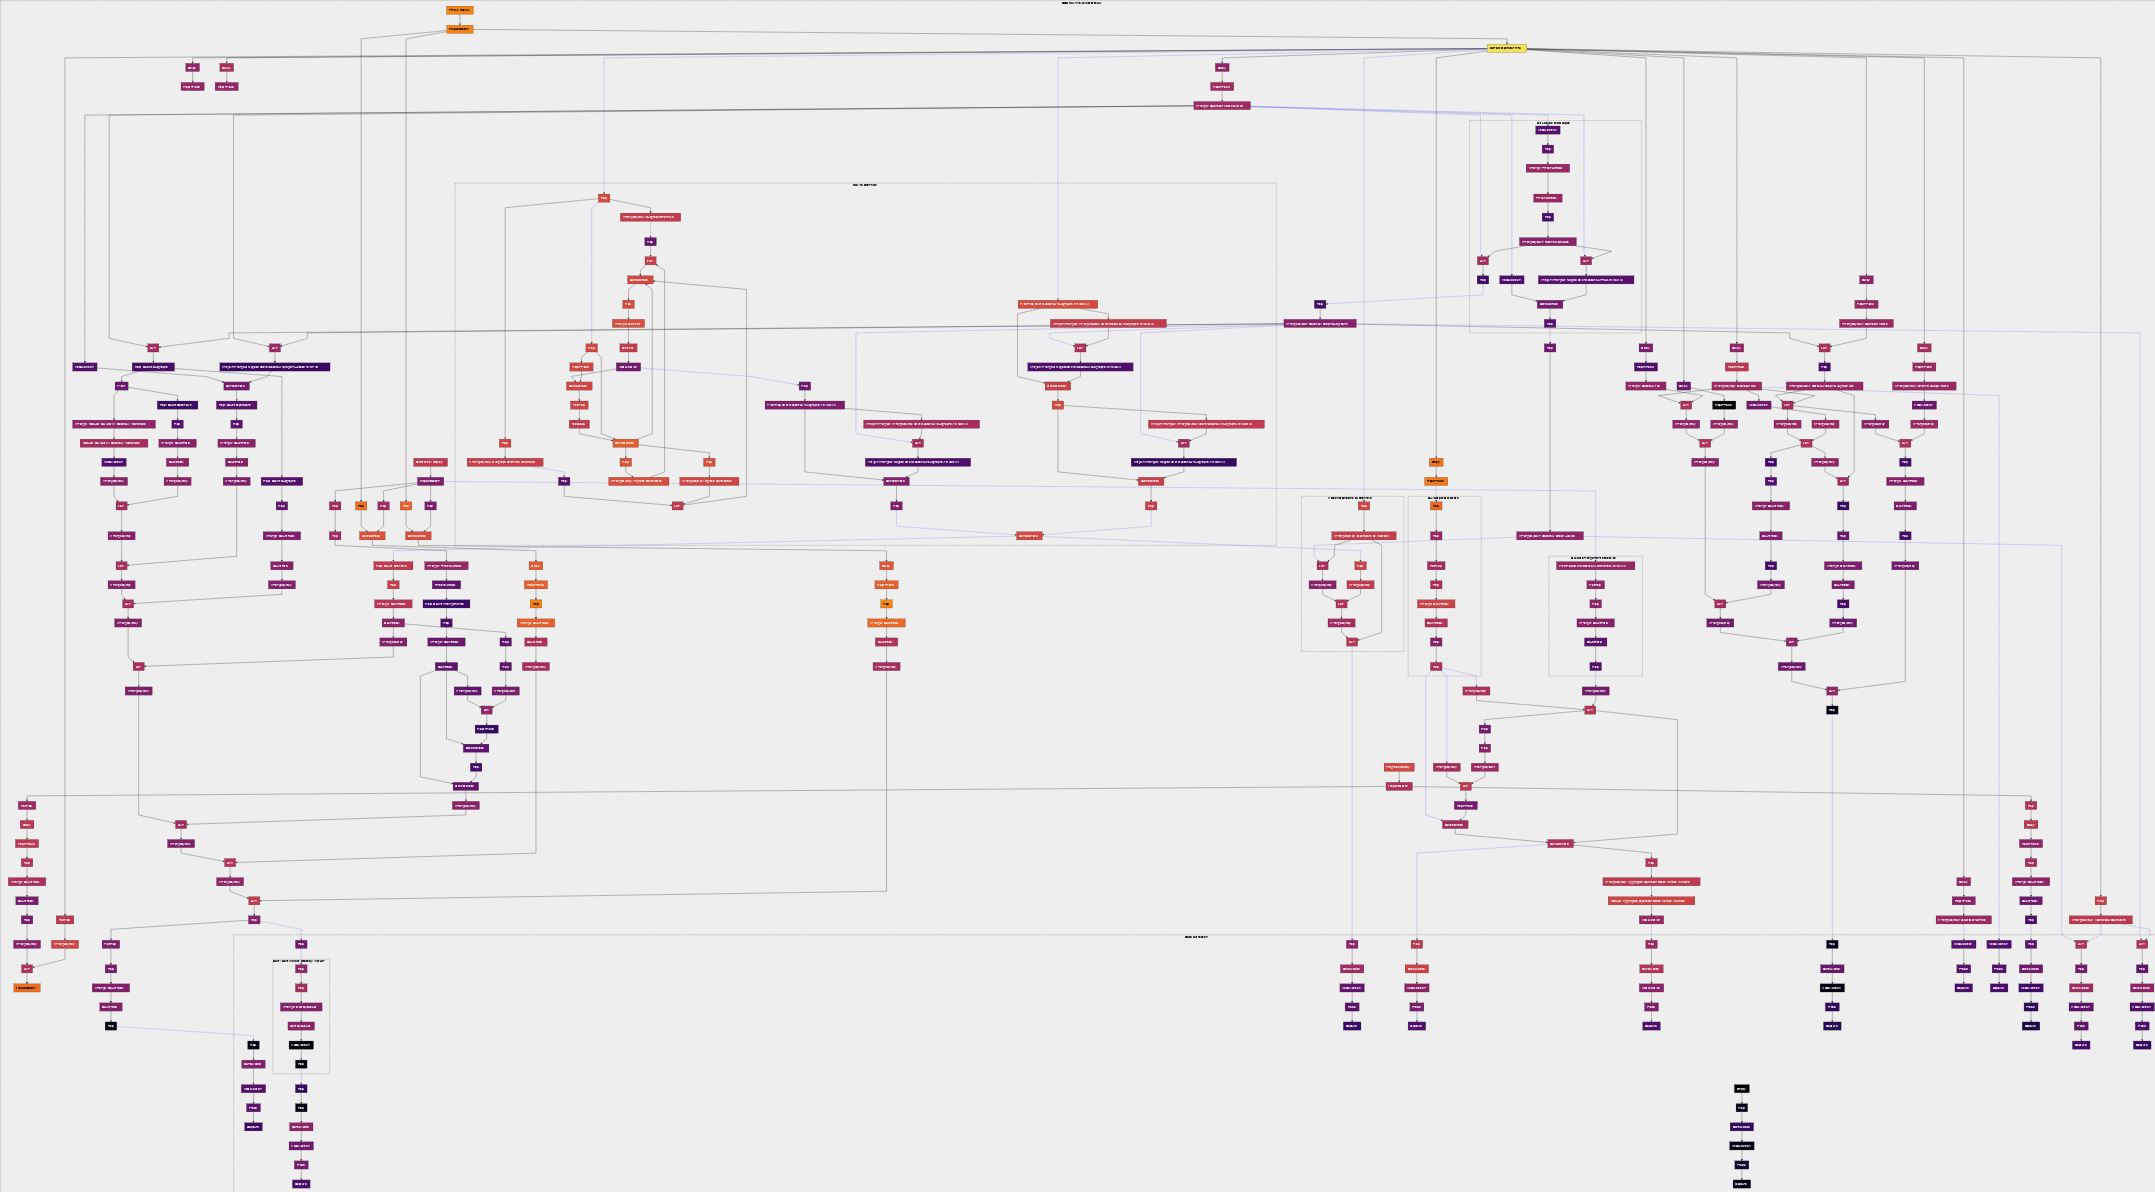
Your one stop CLI for ONNX model analysis. Featuring graph visualization, FLOP counts, memory metrics and more! ⚡️ Quick start First, download and ins
Explore interesting Pisano Period visualisations.
Pisano Explore interesting Pisano Period visualisations. About Pisano lets you explore different visualizations of Pisano periods, repeating integer s
Monitoring visualization as an aquarium
Rusty Aquarium A monitoring visualization as an aquarium written in Rust. Demo Run Rusty Aquarium in your browser: Web demo Download executables for d
A better visualization of clang's -ftime-trace output
crofiler: Easier C++ build profiling Understanding why C++ builds get slow has become a lot easier since clang introduced their -ftime-trace build tra

A lightweight cross-platform system-monitoring fltk gui application based on sysinfo
Sysinfo-gui A lightweight cross-platform system-monitoring fltk gui application based on sysinfo. The UI design is inspired by stacer. The svg icons a

A color-coded visualization tool for the instructions of an anchor program
anchor-viz A color-coded visualization tool for the instructions of an anchor program. (This is a schematic of basic-2 from anchor's examples/tutorial

Real-time 3D orientation visualization of a BNO055 IMU using Bissel and Bevy
orientation This is a demonstration of real-time visualization of the attitude of a BNO055 IMU across a wireless network to a Bevy app using the Bisse
A pure Rust visualization library inspired by D3.js
charts A pure Rust visualization library inspired by D3.js. See gallery and examples for code and more charts. Install You can add this as a dependenc

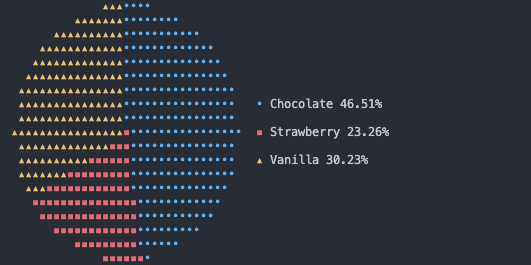
a rust crate for drawing fancy pie charts in the terminal
piechart piechart is a rust crate for drawing fancy pie charts in the terminal. Example usage: use piechart::{Chart, Color, Data}; fn main() { le
📝 Web-based, reactive Datalog notebooks for data analysis and visualization
📝 Web-based, reactive Datalog notebooks for data analysis and visualization
📝 Web-based, reactive Datalog notebooks for data analysis and visualization
Percival is a declarative data query and visualization language. It provides a reactive, web-based notebook environment for exploring complex datasets, producing interactive graphics, and sharing results.

A framework independent animation library for rust, works nicely with Iced and the others
anim A framework independent animation library for rust, works nicely with Iced and the others. Showcase How to install? Include anim in your Cargo.to

This is an implementation of an Iced backend for Plotters, for both native and wasm applications.
plotters-iced This is an implementation of an Iced backend for Plotters, for both native and wasm applications. This backend has been optimized as for

3D Solar System visualization
Description This project is an unrealistic 3D Solar System visualization. It was made for Computer graphics course, that I took at the University of W

binocle is a graphical tool to visualize binary data
a graphical tool to visualize binary data

Terminal disk space navigator 🔭
Given a path on your hard-drive (which could also be the root path, eg. /). diskonaut scans it and indexes its metadata to memory so that you could explore its contents (even while still scanning!).

📺(tv) Tidy Viewer is a cross-platform CLI csv pretty printer that uses column styling to maximize viewer enjoyment.
📺(tv) Tidy Viewer is a cross-platform CLI csv pretty printer that uses column styling to maximize viewer enjoyment.

Barnes-Hut t-SNE implementation written in Rust.
bhtsne Barnes-Hut implementation of t-SNE written in Rust. The algorithm is described with fine detail in this paper by Laurens van der Maaten. Instal

Conkys weird terminal cousin
Monitor and display various things by reading stdout from scripts or programs
Non-Linear Ray Casting
linon Non-Linear Ray Casting References E. Gröller, “Nonlinear Ray Tracing: Visualizing Strange Worlds,” The Visual Computer, vol. 11, no. 5, pp. 263–

🔵🟠 Portal Explorer — web visualization of mind-blowing portals using ray-tracing.
In Portal Explorer you can view how interesting portals are constructed, and visually explore their properties by moving and rotating them. This program doesn't work well on mobile, better opened from PC.

Visualization for Timely Dataflow and Differential Dataflow programs
DDShow Visualization for Timely Dataflow and Differential Dataflow programs Getting started with ddshow First, install ddshow via cargo. As of now dds
A rust drawing library for high quality data plotting for both WASM and native, statically and realtimely 🦀 📈🚀
Plotters - A Rust drawing library focus on data plotting for both WASM and native applications 🦀 📈 🚀 Plotters is drawing library designed for rende
Plotly for Rust
Plotly.rs Plotly for Rust Getting Started | Recipes | API Docs | Changelog | | | A plotting library for Rust powered by Plotly.js. Usage Add this to y

A small charting/visualization tool and partial vega implementation for Rust
Gust A charting library for rust! Disclaimer This is still very much a work in progress! APIs are very unstable and subject to change. Contributions a

Terminal disk space navigator 🔭
diskonaut How does it work? Given a path on your hard-drive (which could also be the root path, eg. /). diskonaut scans it and indexes its metadata to