Monitoring visualization as an aquarium

Overview

Rusty Aquarium

Cross-compile

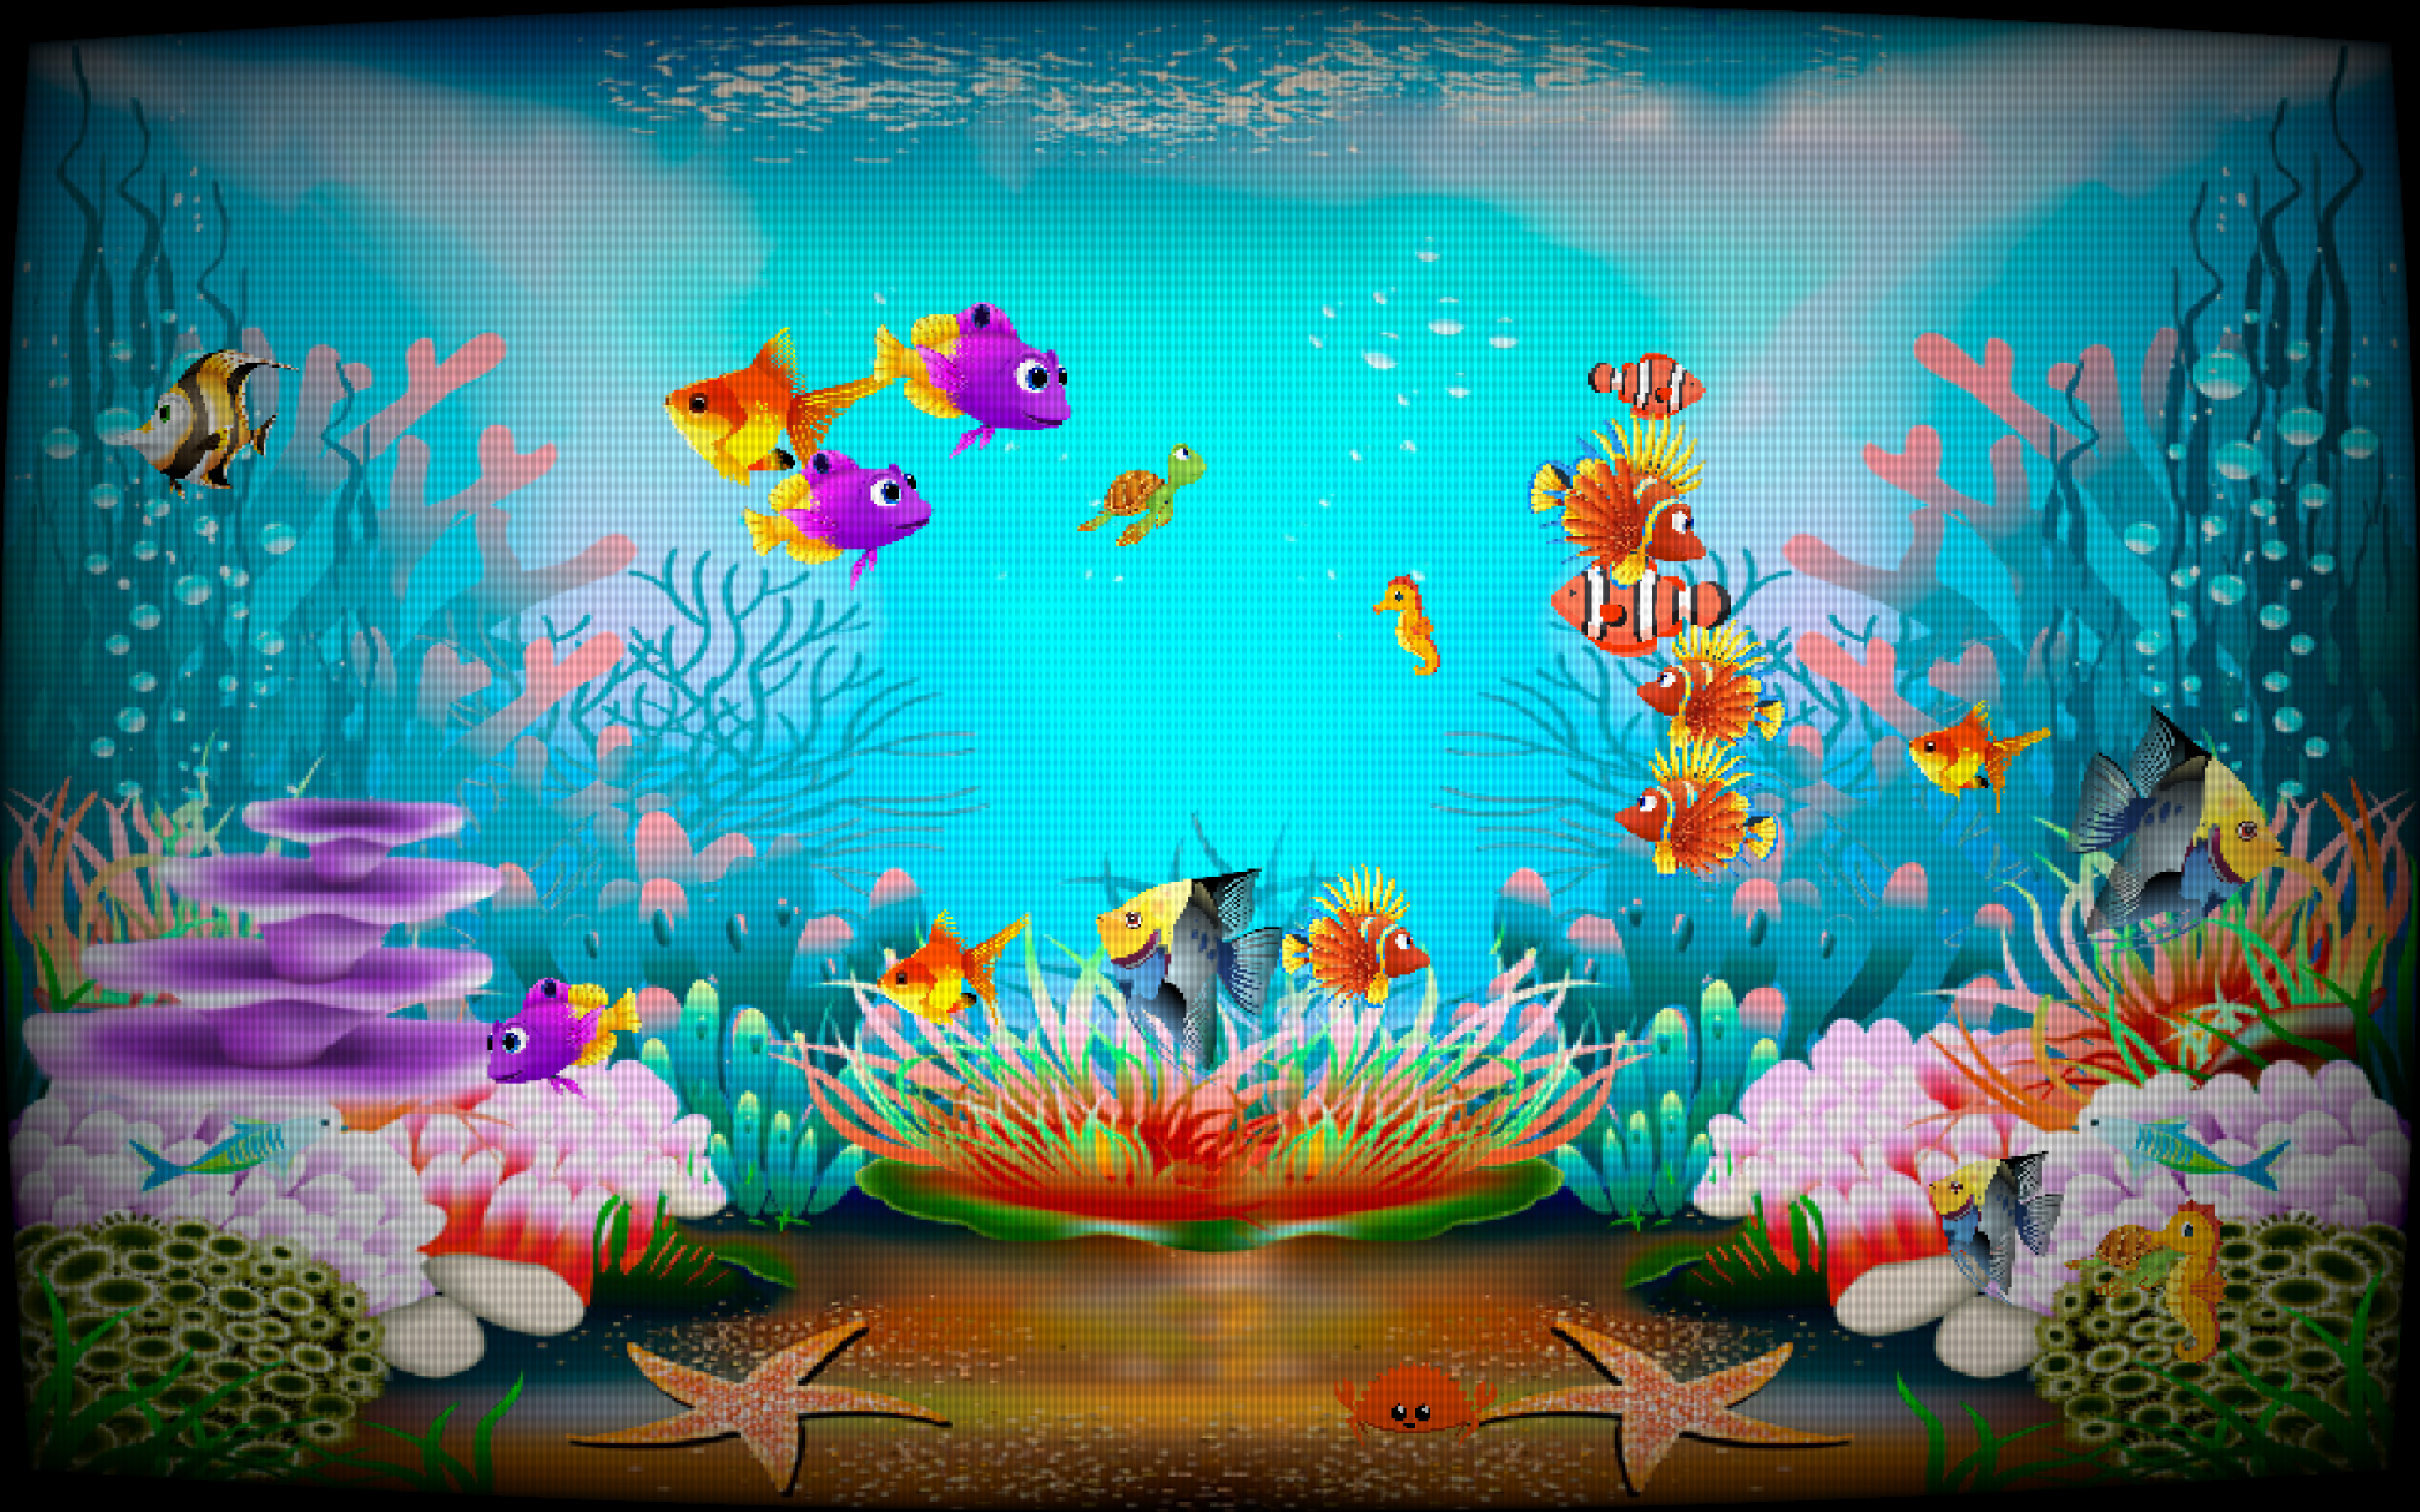
A monitoring visualization as an aquarium written in Rust.

Screenshot

Demo

Run Rusty Aquarium in your browser:

Download executables for different platforms:

Usage

Use these keys to control the fish tank.

  • Escape - Exit the program. Not available on web.
  • Left - Toggle shader.
  • Right - Switch to next scene.
  • Space - Lock/Unlock automatic scene switching.
  • Enter - Refreshes the list of fishes.
  • Up - Add a random fish to the tank.
  • Down - Remove the latest added fish from the tank.
  • C - Reload config.json file. Does not currently reload images.
  • D - Force reload of data file of current scene.
  • L / I - Show screen with description of fishes.
  • H - Display help screen with shortcuts.

Generate input data

The file assets/inputdata.json is read to define what fish to display.

The field school must be an array of objects, one for each fish to display.

The fish field must match a name in the map of fishes in the config.json file.

The fields size, speed, and bubbles are multipliers that will be applied to the corresponding value from the fish configuration.

The legend field is optional, and can be used to send information to show when opening the legend screen. The description will be shown at the top, and each fish_legend will be shown in a list below it. If present, this will override the legend field in the scene configuration.

Example

{
    "legend": {
        "description": "A description to be shown when showing legend.",
        "fish_legends": [
            {
                "fish": "crab",
                "description": "A description of this fish type."
            }
        ]
    },
    "school": [
        { "fish": "crab", "size": 1.0, "speed": 1.0, "bubbles": 1.0 },
    ]
}

System monitoring

The systemdata binary generates an inputdata.json file based on CPU, processes and disks.

cd src/lib/systemdata; cargo run > ../../../assets/inputdata.json

Configuration

The file assets/config.json can be used to configure the fish tank. It has some general configuration values, paths to PNG files to load for background images and fish sprites. It also defines which fish types are available, with default values for them.

File format

  • input_data_path - Path to local file or full URL to inputdata.json file.
  • display_time - Reload inputdata.json after this number of seconds. Set to 0 to never reload data.
  • backgrounds - An array of strings with filenames of PNG images to use as background images, loaded from the assets directory.
  • display_time - Number of seconds between data reloads (0 to never reload)
  • scenes - An array of scene configurations. If no scenes are configured, the top level values for input_data_path and display_time will be used instead
    • input_data_path - Path to load when showing this scene
    • display_time - Number of seconds to show scene before switching to next
    • background - The number of the background texture to show for this scene
    • legend - (Optional) Legend information to display on this scene (same format as in inputdata)
  • fishes - A list of fish type definitions, the key is used to select the fish type in inputdata.json
    • texture - Path to the PNG file to use for this fish.
    • size - Max size to scale the image to.
    • size_randomness - A multiplier used when randomizing fishes. Should be between 0.0 and 1.0.
    • movement - Name of the type of movement for this fish. Available movements: SingleSpeed, Accelerating, AcceleratingEdgeIdling, Crab, Random,
    • bubbles - Number of movement bubbles to show after this fish. Set to 0 to not display any bubbles.
    • collision_aversion - A number between 0 and 1. The higher the number, the less chance that the fish changes direction when colliding.
    • speed - The speed of the fish in X and Y direction.
    • speed_randomness - A multiplier used when randomizing fish speed. Should be between 0.0 and 1.0.
    • area - The area this fish can move in. Max X is 100, max Y is 62.5.

Example

{
    "input_data_path": "assets/inputdata.json",
    "display_time": 10,
    "backgrounds": [
        "assets/background.png",
    ],
    "scenes": [
        {
            "input_data_path": "inputdata.json",
            "display_time": 5,
            "background": 3
        },
        {
            "input_data_path": "inputdata2.json",
            "display_time": 5,
            "background": 2,
            "legend": {
                "description": "These are the different fishes in this aquarium.",
                "fish_legends": [
                    {
                        "fish": "crab",
                        "description": "A happy rustacean!"
                    }
                ]
            }
        }
    ],
    "fishes": {
        "crab": {
            "texture": "assets/ferris.png",
            "size": 7.0,
            "size_randomness": 1.0,
            "movement": "Crab",
            "bubbles": 0,
            "collision_aversion": 0.3,
            "speed": {
                "x": 12.0,
                "y": 4.0
            },
            "speed_randomness": {
                "x": 1.0,
                "y": 1.0
            },
            "area": {
                "x": 5.0,
                "y": 56.0,
                "w": 90.0,
                "h": 6.0
            }
        },
    }
}

License

The code for Rusty Aquarium is released under the MIT License. See LICENSE file for more details.

The images are not covered by the license, and are to the best of my knowledge public domain.

Build scripts

The build scripts require the cargo-run-scripts package to be installed.

cargo install cargo-run-script

Build a web package in demo/

cargo run-script build-web

Start a web server

cargo run-script serve-web

Build windows binary

cargo run-script build-win

Build Android APK

cargo run-script build-apk
You might also like...
A free and open-source DNA Sequencing/Visualization software for bioinformatics research.

DNArchery 🧬 A free and open-source cross-platform DNA Sequencing/Visualization Software for bioinformatics research. A toolkit for instantly performi

A high-performance web-based geospatial visualization tool with an emphasis LEO satellites and lunar missions.

A high-performance web-based geospatial visualization tool with an emphasis LEO satellites and lunar missions. Written in Rust to target WebGPU, with WebGL2 backwards compatibility.

Theorem relational dependencies automatic extraction and visualization as a graph for Lean4.

Lean Graph Interactive visualization of dependencies for any theorem/definitions in your Lean project. How to use In your browser: lean-graph.com Or r

Small and simple stateful applications, designed to facilitate the monitoring of unwanted behaviors of the same.

Violet Violet é um pequeno e simples monitorador de aplicação, voltado para receber eventos de erro e estado. Instalação simples: Dependencias: Docker

Simple system monitoring app that runs on terminal. Made purely with Rust.

What is it? RCTOP is a simple WIP system monitoring app that runs purely on terminal and doesn't feature GUI. One can compare it to htop, but more str

This is my home environment setup for monitoring temperature and humidity

Home EnViroNment Motivation This is my IoT temperature and humidity monitoring solution for where i live. I found it cheaper to go buy sensors and hoo

A small monitoring process that checks if kstars is active, if not it sends a request to notify a user via telegram that it crashed

Astro monitor A small monitoring process that checks if kstars is active, if not it sends a request to notify a user via telegram that it crashed Inst

zigfi is an open-source stocks, commodities and cryptocurrencies price monitoring CLI app, written fully in Rust, where you can organize assets you're watching easily into watchlists for easy access on your terminal.

zigfi zigfi is an open-source stocks, commodities and cryptocurrencies price monitoring CLI app, written fully in Rust, where you can organize assets

Ingraind - a security monitoring agent built around RedBPF for complex containerized environments and endpoints.

ingraind is a security monitoring agent built around RedBPF for complex containerized environments and endpoints. The ingraind agent uses eBPF probes to provide safe and performant instrumentation for any Linux-based environment.

Garden monitoring system using m328p and m2560 Arduino Uno boards

Garden monitoring system using m328p and m2560 Arduino Uno boards. 100% Rust [no_std] using the avr hardware abstraction layer (avr-hal)

Garden monitoring system using m328p Arduino Uno boards. 100% Rust [no_std] using the avr hardware abstraction layer (avr-hal)

uno-revive-rs References Arduino Garden Controller Roadmap uno-revive-rs: roadmap Components & Controllers 1-2 Uno R3 m328p Soil moisture sensor: m328

rusty-riscy is a performance testing and system resource monitoring tool written in Rust to benchmark RISC-V processors.

rusty-riscy rusty-riscy is a performance testing and system resource monitoring tool written in Rust to benchmark RISC-V processors. Objectives To cre

A lightweight cross-platform system-monitoring fltk gui application based on sysinfo

Sysinfo-gui A lightweight cross-platform system-monitoring fltk gui application based on sysinfo. The UI design is inspired by stacer. The svg icons a

A tool to control the fan speed by monitoring the temperature of CPU via IPMI.

ipmi-fan-control A tool to control the fan speed by monitoring the temperature of CPU via IPMI. Why Our Dell R730 server's iDRAC is not works as expec

A minimalistic cross-platform malware scanner with non-blocking realtime filesystem monitoring using YARA rules.

Sauron is a minimalistic, YARA based malware scanner with realtime filesystem monitoring written in Rust. Features Realtime scan of created and modifi

A CLI screentime monitoring tool. Shows how much time are you using certain apps.

A screentime monitoring tool, shows how much time are you really using certain apps. It work nicely with i3status or py3status on I3 window manager fo

Conference Monitoring Project based on Image Recognition that uses Rust Language and AWS Rekognition service to get the level of image similarity.

Conference Monitoring System based on Image Recognition in Rust This is a Conference Monitoring Project based on Image Recognition that uses Rust Lang

Using iced-rs library for YT monitoring app

YouTube Monitoring App (using Rust) Description This app is built on the top of iced library. If you're curious what this is about, check out the YT m

MinMon - an opinionated minimal monitoring and alarming tool

MinMon - an opinionated minimal monitoring and alarming tool (for Linux) This tool is just a single binary and a config file. No database, no GUI, no

Comments
  • Display legend info on keypress

    Display legend info on keypress

    To make it easier to understand the data shown, it should be possible to open up an information screen with a description.

    The description text could be markdown sent with the input data. Possibly make use of rusty-slider.

    It would be nice to be able to have description of each fish. Maybe add description for each fish type in input data, and display the fish image with the description.

    enhancement 
    opened by ollej 1
  • Add command line option to disable debug features

    Add command line option to disable debug features

    Debig festures such as adding/removing fish should be possible to disable when run in production mode. Possibly, the default should be to have them disabled.

    opened by ollej 0
Releases(v0.17.0)
Owner
Olle Wreede
Olle Wreede
Visualization for Timely Dataflow and Differential Dataflow programs

DDShow Visualization for Timely Dataflow and Differential Dataflow programs Getting started with ddshow First, install ddshow via cargo. As of now dds

Chase Wilson 61 Nov 25, 2022
🔵🟠 Portal Explorer — web visualization of mind-blowing portals using ray-tracing.

In Portal Explorer you can view how interesting portals are constructed, and visually explore their properties by moving and rotating them. This program doesn't work well on mobile, better opened from PC.

ilya sheprut 99 Dec 7, 2022
3D Solar System visualization

Description This project is an unrealistic 3D Solar System visualization. It was made for Computer graphics course, that I took at the University of W

Michał Sala 1 Feb 22, 2022
📝 Web-based, reactive Datalog notebooks for data analysis and visualization

Percival is a declarative data query and visualization language. It provides a reactive, web-based notebook environment for exploring complex datasets, producing interactive graphics, and sharing results.

Eric Zhang 486 Dec 28, 2022
📝 Web-based, reactive Datalog notebooks for data analysis and visualization

?? Web-based, reactive Datalog notebooks for data analysis and visualization

Eric Zhang 486 Dec 28, 2022
A pure Rust visualization library inspired by D3.js

charts A pure Rust visualization library inspired by D3.js. See gallery and examples for code and more charts. Install You can add this as a dependenc

Iulian Gulea 186 Dec 29, 2022
Real-time 3D orientation visualization of a BNO055 IMU using Bissel and Bevy

orientation This is a demonstration of real-time visualization of the attitude of a BNO055 IMU across a wireless network to a Bevy app using the Bisse

chris m 4 Dec 10, 2022
A color-coded visualization tool for the instructions of an anchor program

anchor-viz A color-coded visualization tool for the instructions of an anchor program. (This is a schematic of basic-2 from anchor's examples/tutorial

cavemanloverboy 5 Oct 15, 2022
A better visualization of clang's -ftime-trace output

crofiler: Easier C++ build profiling Understanding why C++ builds get slow has become a lot easier since clang introduced their -ftime-trace build tra

Hadrien G. 7 Nov 15, 2022
High-performance time series downsampling algorithms for visualization

tsdownsample ?? Time series downsampling algorithms for visualization Features ✨ Fast: written in rust with PyO3 bindings leverages optimized argminma

PreDiCT.IDLab 5 Dec 8, 2022