A rust drawing library for high quality data plotting for both WASM and native, statically and realtimely πŸ¦€ πŸ“ˆπŸš€

Overview

Plotters - A Rust drawing library focus on data plotting for both WASM and native applications πŸ¦€ πŸ“ˆ πŸš€

Plotters is drawing library designed for rendering figures, plots, and charts, in pure rust. Plotters supports various types of back-ends, including bitmap, vector graph, piston window, GTK/Cairo and WebAssembly.

  • A new Plotters Developer's Guide is working in progress. The preview version is available at here.
  • To try Plotters with interactive Jupyter notebook, or view here for the static HTML version.
  • To view the WASM example, go to this link
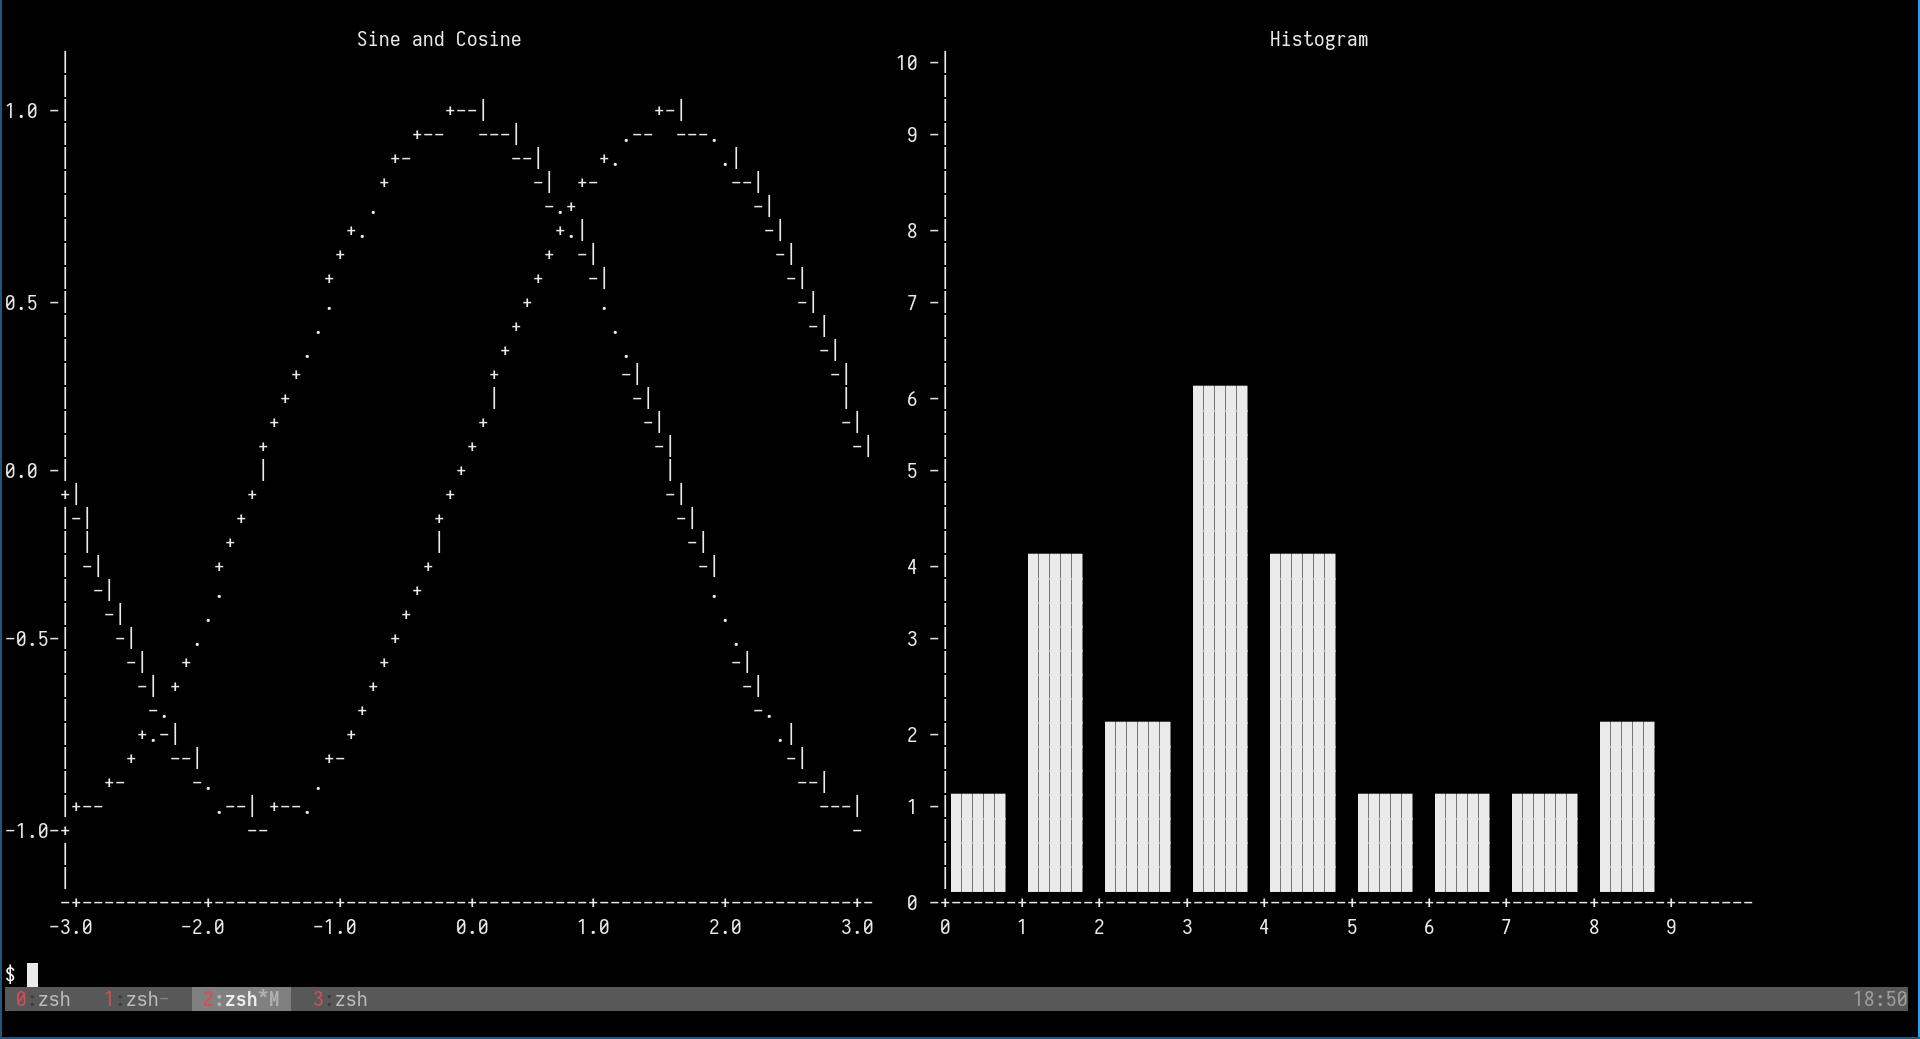
  • Currently we have all the internal code ready for console plotting, but a console based backend is still not ready. See this example for how to plotting on Console with a customized backend.
  • Plotters now moved all backend code to sperate repository, check FAQ list for details

Gallery

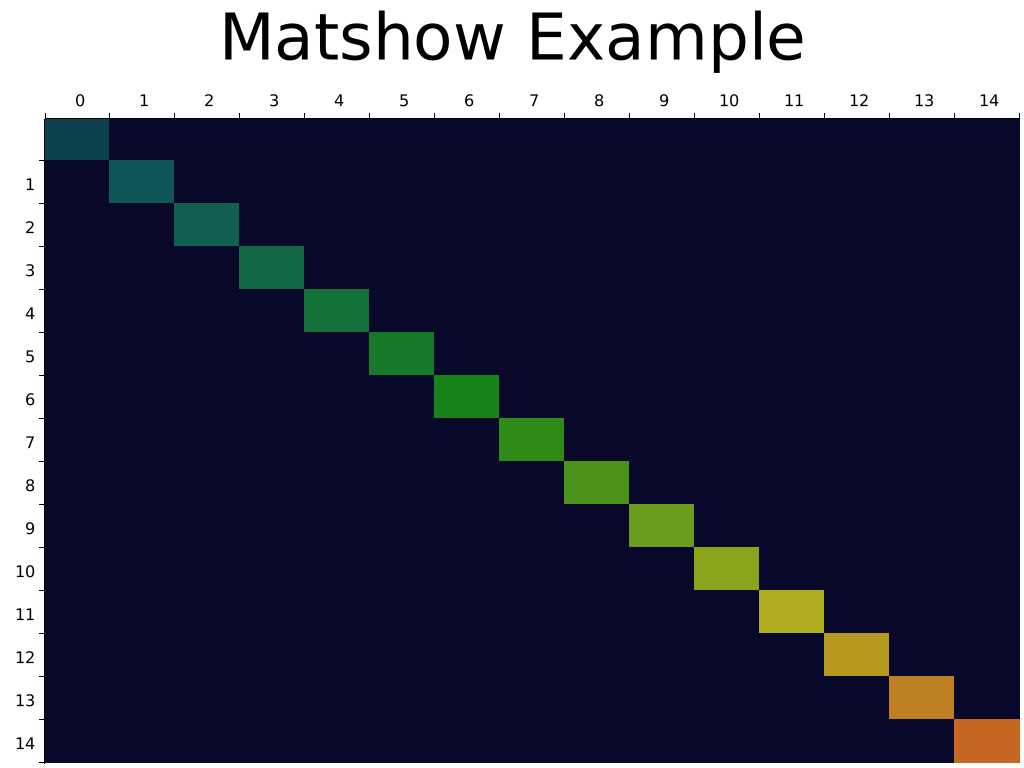
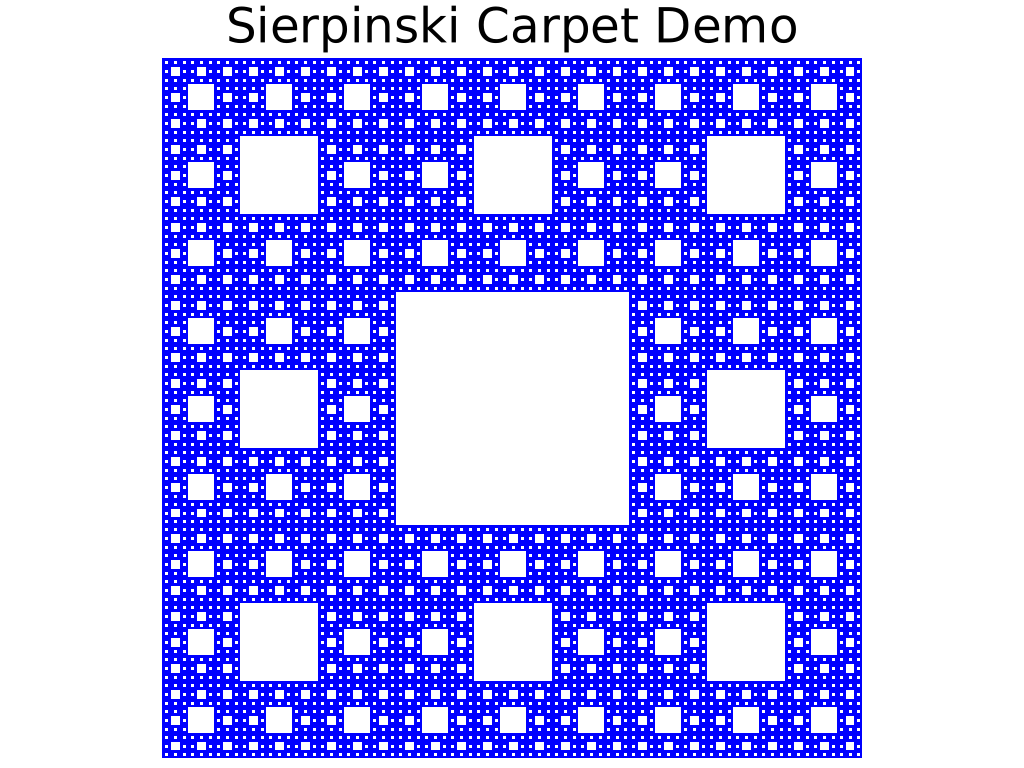
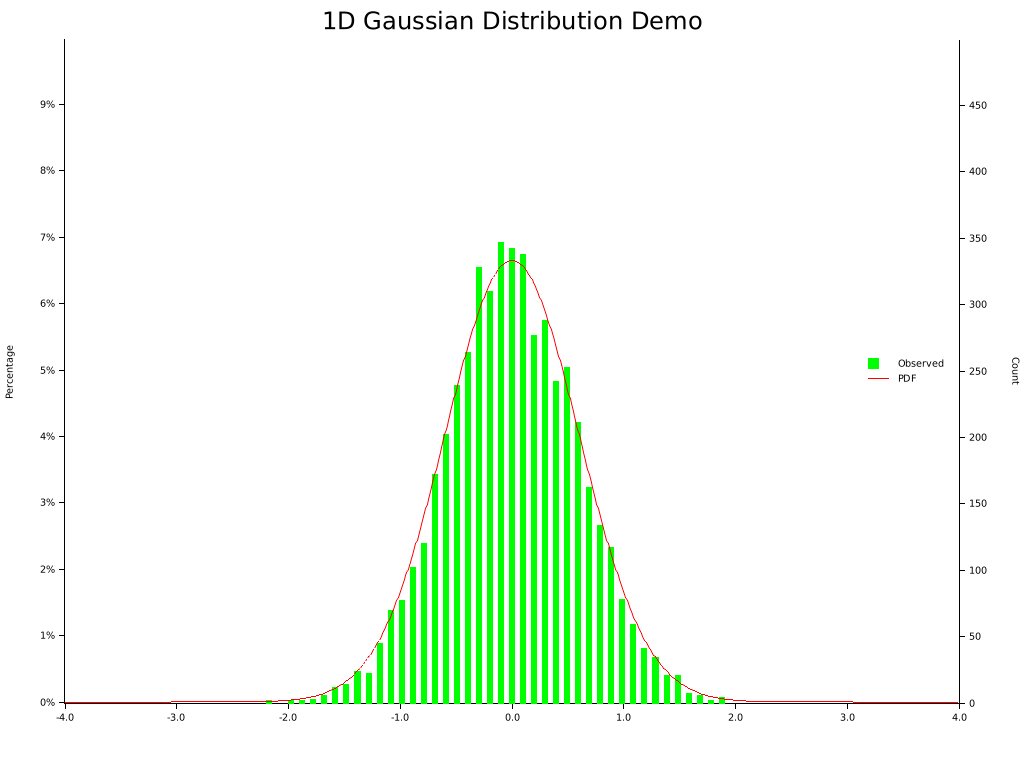
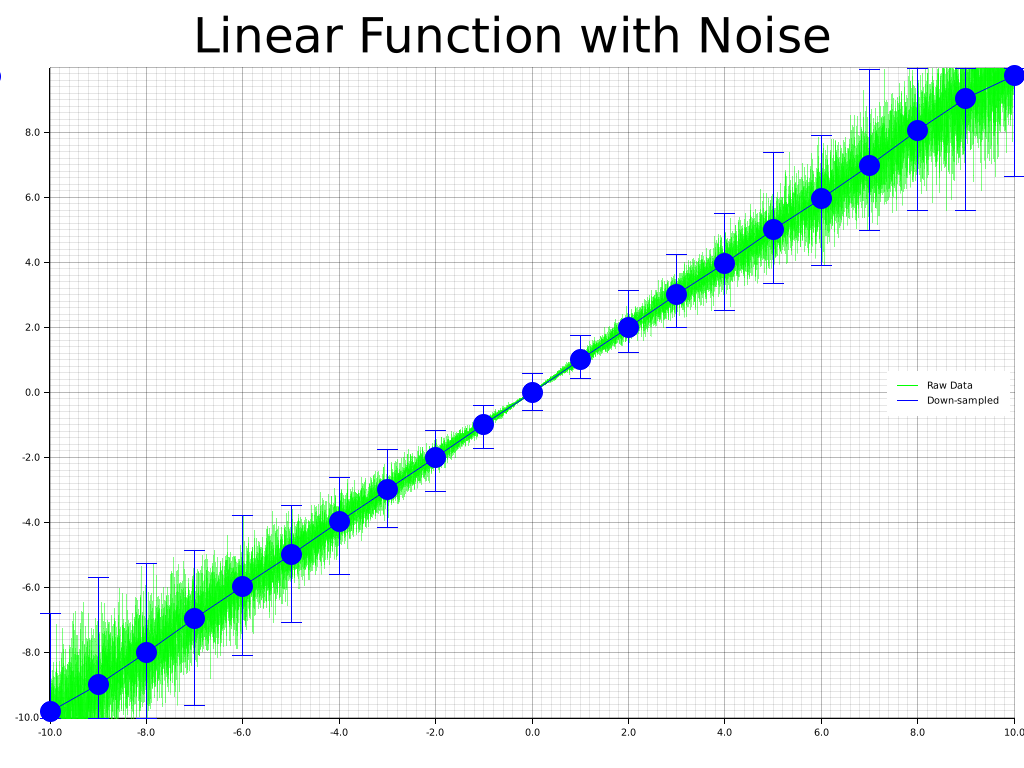
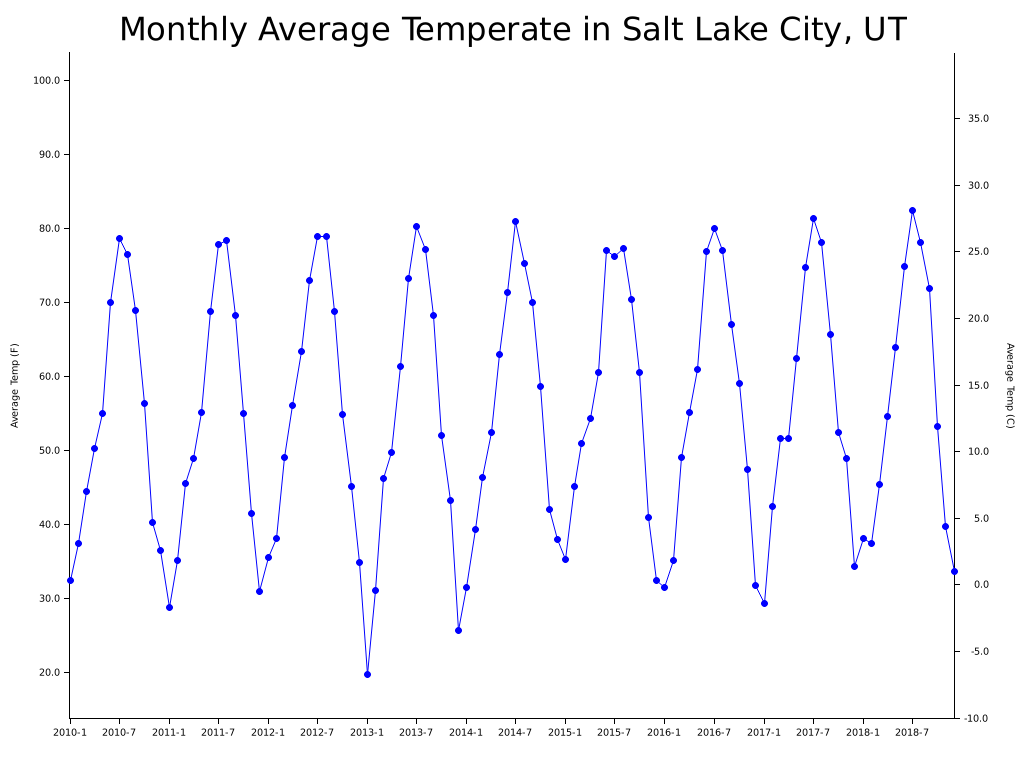
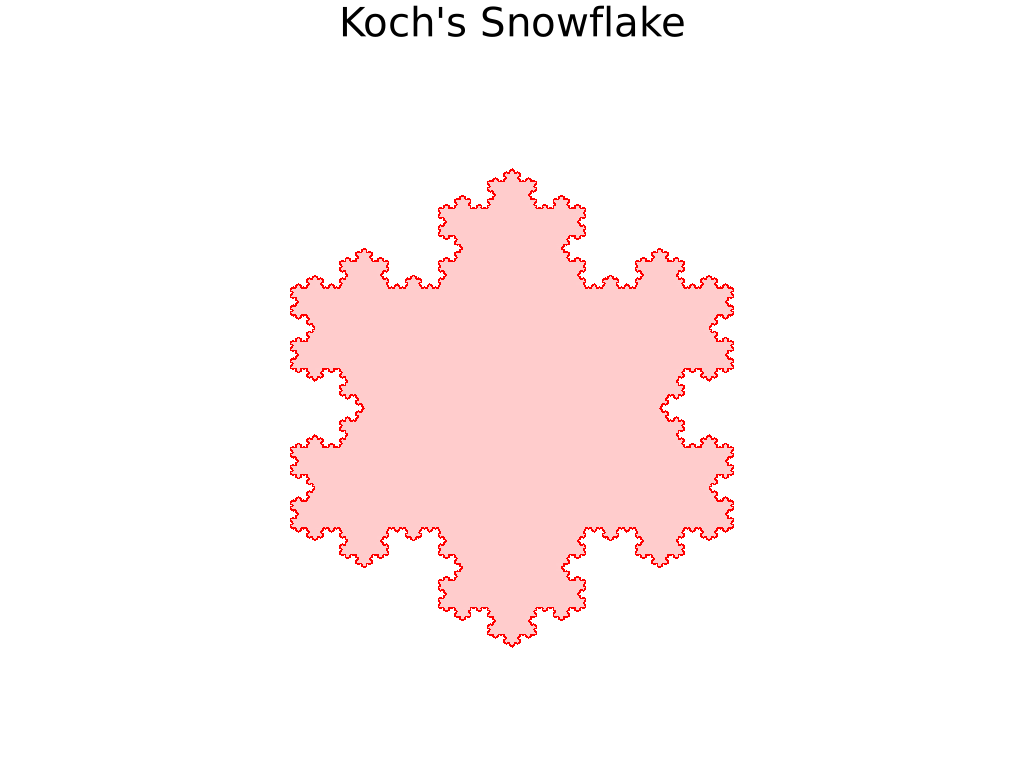
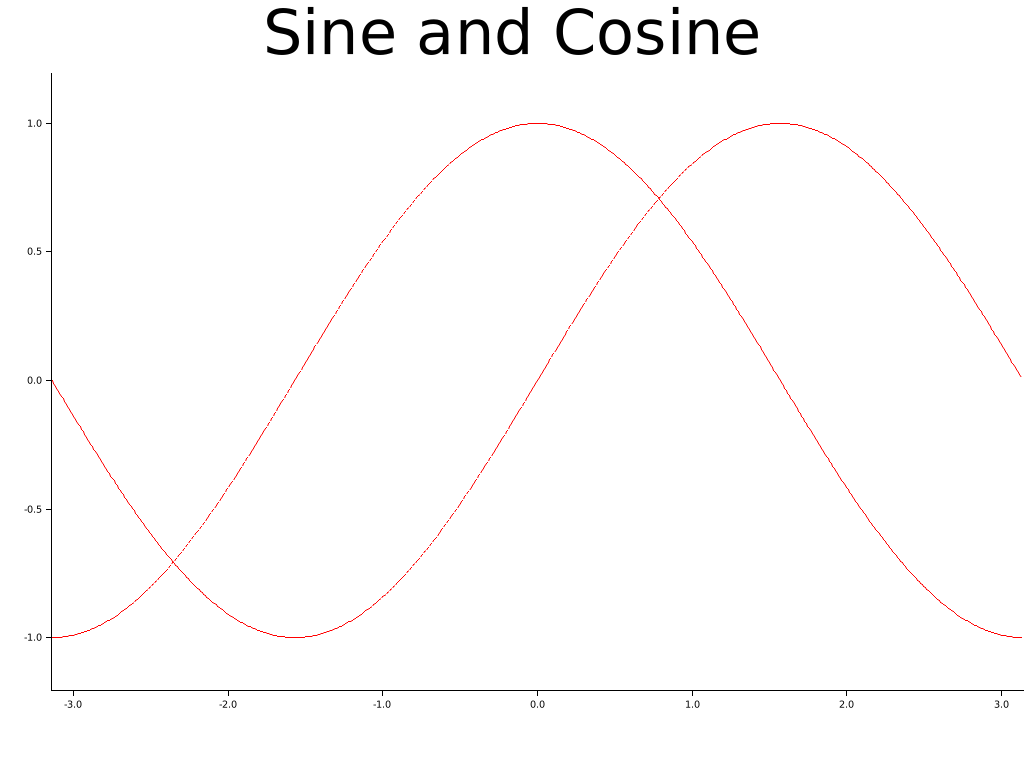
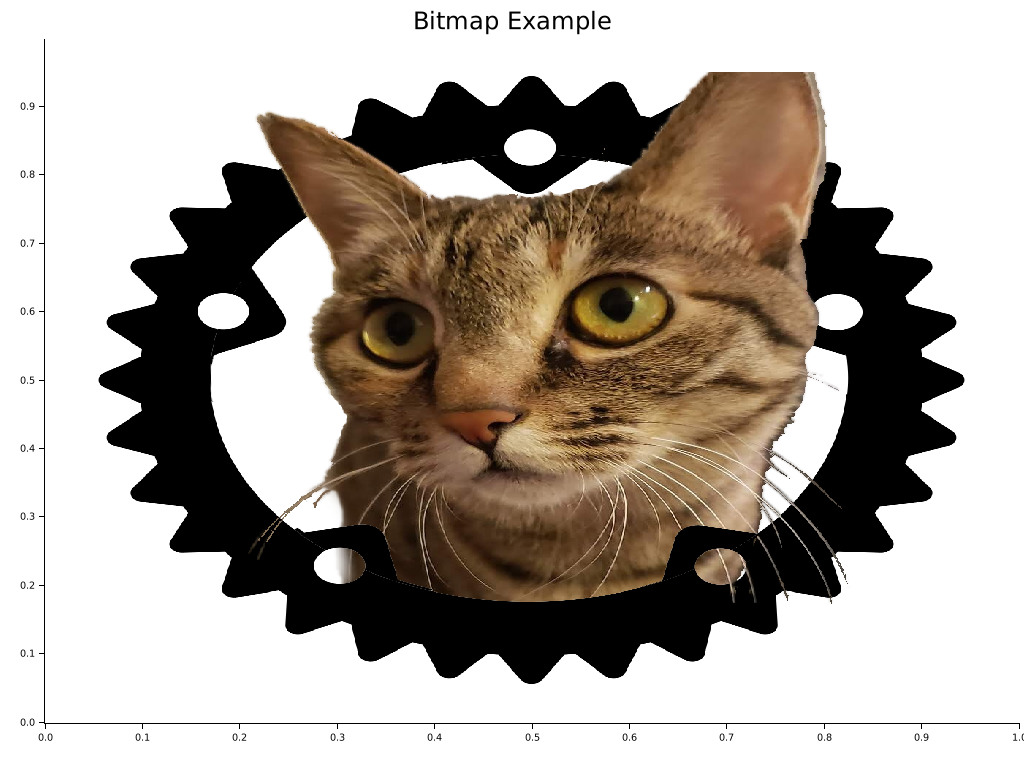
To view the source code for each example, please click on the example image.

Table of Contents

Quick Start

To use Plotters, you can simply add Plotters into your Cargo.toml

[dependencies]
plotters = "^0.3.0"

And the following code draws a quadratic function. src/main.rs,

use plotters::prelude::*;
fn main() -> Result<(), Box<dyn std::error::Error>> {
    let root = BitMapBackend::new("plotters-doc-data/0.png", (640, 480)).into_drawing_area();
    root.fill(&WHITE)?;
    let mut chart = ChartBuilder::on(&root)
        .caption("y=x^2", ("sans-serif", 50).into_font())
        .margin(5)
        .x_label_area_size(30)
        .y_label_area_size(30)
        .build_cartesian_2d(-1f32..1f32, -0.1f32..1f32)?;

    chart.configure_mesh().draw()?;

    chart
        .draw_series(LineSeries::new(
            (-50..=50).map(|x| x as f32 / 50.0).map(|x| (x, x * x)),
            &RED,
        ))?
        .label("y = x^2")
        .legend(|(x, y)| PathElement::new(vec![(x, y), (x + 20, y)], &RED));

    chart
        .configure_series_labels()
        .background_style(&WHITE.mix(0.8))
        .border_style(&BLACK)
        .draw()?;

    Ok(())
}

Trying with Jupyter evcxr Kernel Interactively

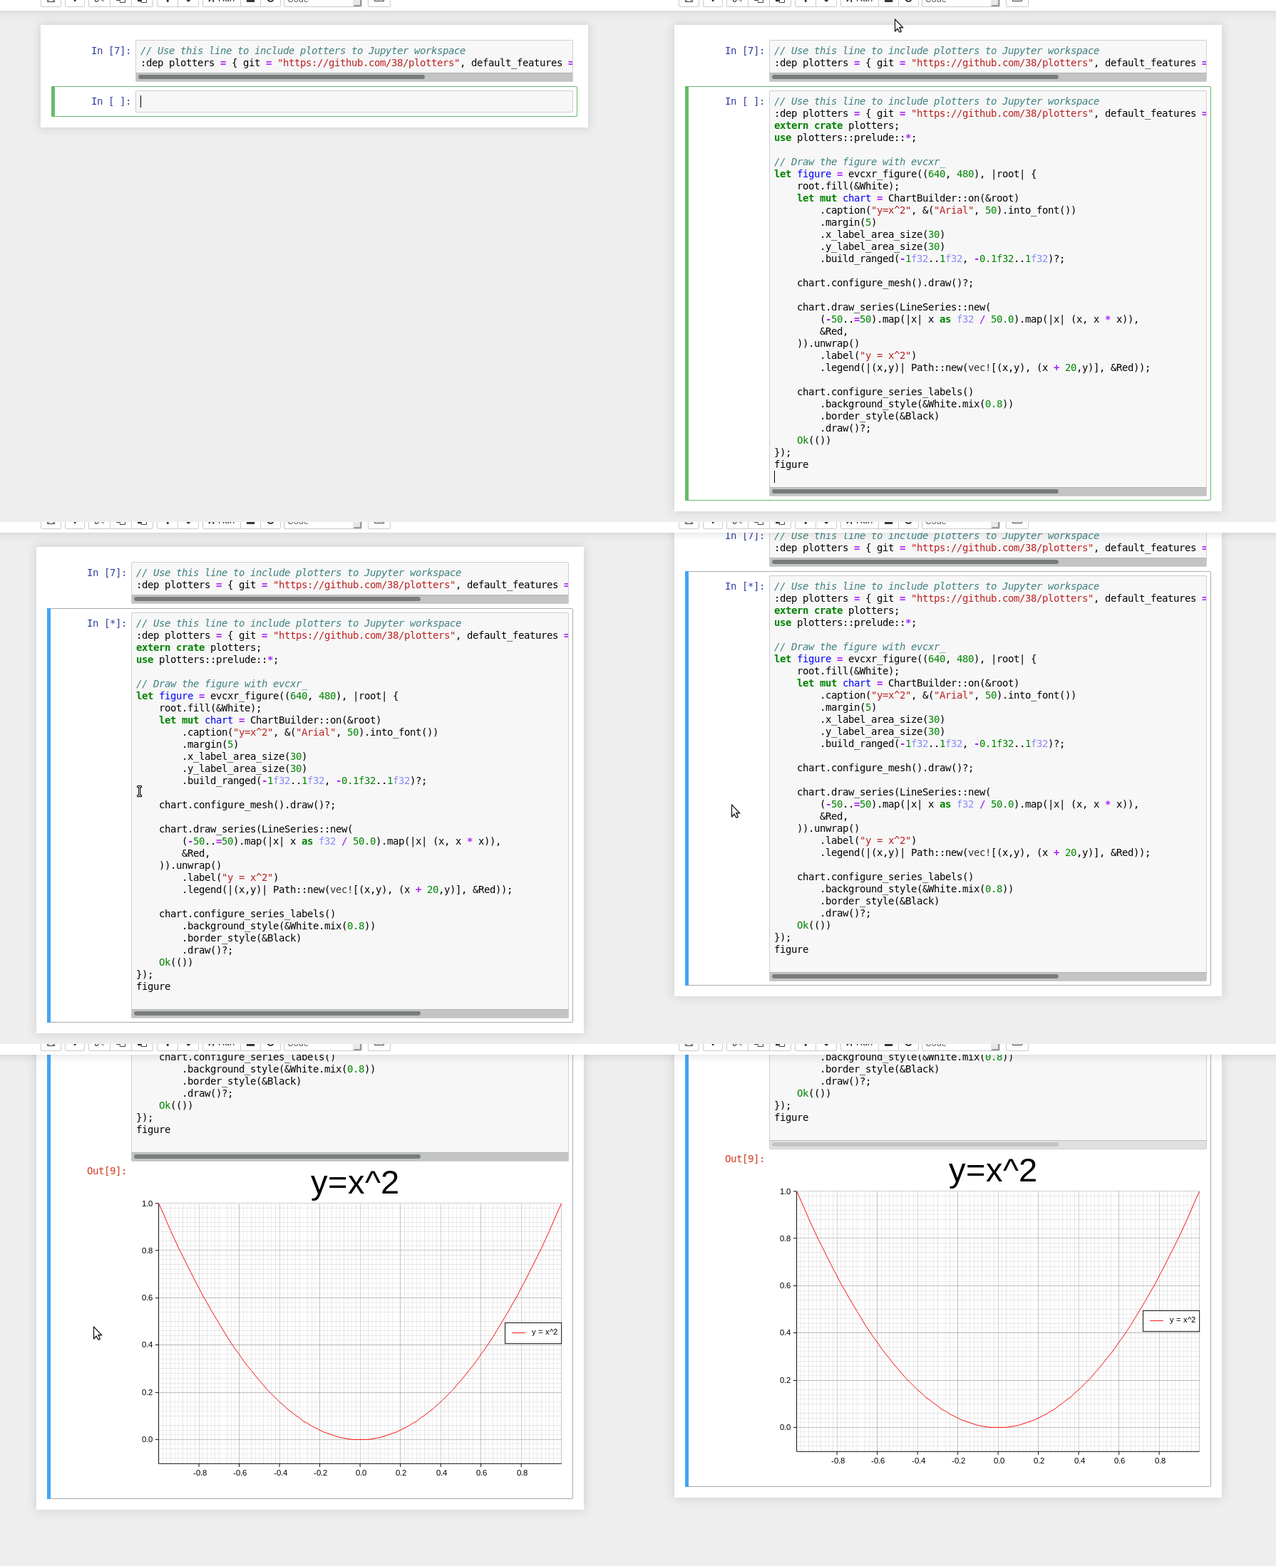
Plotters now supports integrate with evcxr and is able to interactively drawing plots in Jupyter Notebook. The feature evcxr should be enabled when including Plotters to Jupyter Notebook.

The following code shows a minimal example of this.

:dep plotters = { git = "https://github.com/38/plotters", default_features = false, features = ["evcxr"] }
extern crate plotters;
use plotters::prelude::*;

let figure = evcxr_figure((640, 480), |root| {
    root.fill(&WHITE);
    let mut chart = ChartBuilder::on(&root)
        .caption("y=x^2", ("Arial", 50).into_font())
        .margin(5)
        .x_label_area_size(30)
        .y_label_area_size(30)
        .build_cartesian_2d(-1f32..1f32, -0.1f32..1f32)?;

    chart.configure_mesh().draw()?;

    chart.draw_series(LineSeries::new(
        (-50..=50).map(|x| x as f32 / 50.0).map(|x| (x, x * x)),
        &RED,
    )).unwrap()
        .label("y = x^2")
        .legend(|(x,y)| PathElement::new(vec![(x,y), (x + 20,y)], &RED));

    chart.configure_series_labels()
        .background_style(&WHITE.mix(0.8))
        .border_style(&BLACK)
        .draw()?;
    Ok(())
});
figure

Interactive Tutorial with Jupyter Notebook

This tutorial is now working in progress and isn't complete

Thanks to the evcxr, now we have an interactive tutorial for Plotters! To use the interactive notebook, you must have Jupyter and evcxr installed on your computer. Follow the instruction on this page below to install it.

After that, you should be able to start your Jupyter server locally and load the tutorial!

git clone https://github.com/38/plotters-doc-data
cd plotteres-doc-data
jupyter notebook

And select the notebook called evcxr-jupyter-integration.ipynb.

Also, there's a static HTML version of this notebook available at the this location

Plotting in Rust

Rust is a perfect language for data visualization. Although there are many mature visualization libraries in many different languages. But Rust is one of the best languages fits the need.

  • Easy to use Rust has a very good iterator system built into the standard library. With the help of iterators, Plotting in Rust can be as easy as most of the high-level programming languages. The Rust based plotting library can be very easy to use.

  • Fast If you need rendering a figure with trillions of data points, Rust is a good choice. Rust's performance allows you to combine data processing step and rendering step into a single application. When plotting in high-level programming languages, e.g. Javascript or Python, data points must be down-sampled before feeding into the plotting program because of the performance considerations. Rust is fast enough to do the data processing and visualization within a single program. You can also integrate the figure rendering code into your application handling a huge amount of data and visualize it in real-time.

  • WebAssembly Support Rust is one of few the language with the best WASM support. Plotting in Rust could be very useful for visualization on a web page and would have a huge performance improvement comparing to Javascript.

Plotting on HTML5 canvas with WASM Backend

Plotters currently supports backend that uses the HTML5 canvas. To use the WASM support, you can simply use CanvasBackend instead of other backend and all other API remains the same!

There's a small demo for Plotters + WASM under examples/wasm-demo directory of this repo. To play with the deployed version, follow this link.

What types of figure are supported?

Plotters is not limited to any specific type of figure. You can create your own types of figures easily with the Plotters API.

But Plotters provides some builtin figure types for convenience. Currently, we support line series, point series, candlestick series, and histogram. And the library is designed to be able to render multiple figure into a single image. But Plotter is aimed to be a platform that is fully extendable to support any other types of figure.

Concepts by examples

Drawing Back-ends

Plotters can use different drawing back-ends, including SVG, BitMap, and even real-time rendering. For example, a bitmap drawing backend.

use plotters::prelude::*;
fn main() -> Result<(), Box<dyn std::error::Error>> {
    // Create a 800*600 bitmap and start drawing
    let mut backend = BitMapBackend::new("plotters-doc-data/1.png", (300, 200));
    // And if we want SVG backend
    // let backend = SVGBackend::new("output.svg", (800, 600));
    backend.draw_rect((50, 50), (200, 150), &RED, true)?;
    Ok(())
}

Drawing Area

Plotters uses a concept called drawing area for layout purpose. Plotters support multiple integrating into a single image. This is done by creating sub-drawing-areas.

Besides that, the drawing area also allows the customized coordinate system, by doing so, the coordinate mapping is done by the drawing area automatically.

use plotters::prelude::*;
fn main() -> Result<(), Box<dyn std::error::Error>> {
    let root_drawing_area =
        BitMapBackend::new("plotters-doc-data/2.png", (300, 200)).into_drawing_area();
    // And we can split the drawing area into 3x3 grid
    let child_drawing_areas = root_drawing_area.split_evenly((3, 3));
    // Then we fill the drawing area with different color
    for (area, color) in child_drawing_areas.into_iter().zip(0..) {
        area.fill(&Palette99::pick(color))?;
    }
    Ok(())
}

Elements

In Plotters, elements are build blocks of figures. All elements are able to draw on a drawing area. There are different types of built-in elements, like lines, texts, circles, etc. You can also define your own element in the application code.

You may also combine existing elements to build a complex element.

To learn more about the element system, please read the element module documentation.

use plotters::prelude::*;
fn main() -> Result<(), Box<dyn std::error::Error>> {
    let root = BitMapBackend::new("plotters-doc-data/3.png", (300, 200)).into_drawing_area();
    root.fill(&WHITE)?;
    // Draw an circle on the drawing area
    root.draw(&Circle::new(
        (100, 100),
        50,
        Into::<ShapeStyle>::into(&GREEN).filled(),
    ))?;
    Ok(())
}

Composable Elements

Besides the built-in elements, elements can be composed into a logic group we called composed elements. When composing new elements, the upper-left corner is given in the target coordinate, and a new pixel-based coordinate which has the upper-left corner defined as (0,0) is used for further element composition purpose.

For example, we can have an element which includes a dot and its coordinate.

use plotters::prelude::*;
use plotters::coord::types::RangedCoordf32;

fn main() -> Result<(), Box<dyn std::error::Error>> {
    let root = BitMapBackend::new("plotters-doc-data/4.png", (640, 480)).into_drawing_area();

    root.fill(&RGBColor(240, 200, 200))?;

    let root = root.apply_coord_spec(Cartesian2d::<RangedCoordf32, RangedCoordf32>::new(
        0f32..1f32,
        0f32..1f32,
        (0..640, 0..480),
    ));

    let dot_and_label = |x: f32, y: f32| {
        return EmptyElement::at((x, y))
            + Circle::new((0, 0), 3, ShapeStyle::from(&BLACK).filled())
            + Text::new(
                format!("({:.2},{:.2})", x, y),
                (10, 0),
                ("sans-serif", 15.0).into_font(),
            );
    };

    root.draw(&dot_and_label(0.5, 0.6))?;
    root.draw(&dot_and_label(0.25, 0.33))?;
    root.draw(&dot_and_label(0.8, 0.8))?;
    Ok(())
}

Chart Context

In order to draw a chart, Plotters need a data object built on top of the drawing area called ChartContext. The chart context defines even higher level constructs compare to the drawing area. For example, you can define the label areas, meshes, and put a data series onto the drawing area with the help of the chart context object.

use plotters::prelude::*;
fn main() -> Result<(), Box<dyn std::error::Error>> {
    let root = BitMapBackend::new("plotters-doc-data/5.png", (640, 480)).into_drawing_area();
    root.fill(&WHITE);
    let root = root.margin(10, 10, 10, 10);
    // After this point, we should be able to draw construct a chart context
    let mut chart = ChartBuilder::on(&root)
        // Set the caption of the chart
        .caption("This is our first plot", ("sans-serif", 40).into_font())
        // Set the size of the label region
        .x_label_area_size(20)
        .y_label_area_size(40)
        // Finally attach a coordinate on the drawing area and make a chart context
        .build_cartesian_2d(0f32..10f32, 0f32..10f32)?;

    // Then we can draw a mesh
    chart
        .configure_mesh()
        // We can customize the maximum number of labels allowed for each axis
        .x_labels(5)
        .y_labels(5)
        // We can also change the format of the label text
        .y_label_formatter(&|x| format!("{:.3}", x))
        .draw()?;

    // And we can draw something in the drawing area
    chart.draw_series(LineSeries::new(
        vec![(0.0, 0.0), (5.0, 5.0), (8.0, 7.0)],
        &RED,
    ))?;
    // Similarly, we can draw point series
    chart.draw_series(PointSeries::of_element(
        vec![(0.0, 0.0), (5.0, 5.0), (8.0, 7.0)],
        5,
        &RED,
        &|c, s, st| {
            return EmptyElement::at(c)    // We want to construct a composed element on-the-fly
            + Circle::new((0,0),s,st.filled()) // At this point, the new pixel coordinate is established
            + Text::new(format!("{:?}", c), (10, 0), ("sans-serif", 10).into_font());
        },
    ))?;
    Ok(())
}

Misc

Development Version

To use the latest development version, pull https://github.com/38/plotters.git. In Cargo.toml

[dependencies]
plotters = { git = "https://github.com/38/plotters.git" }

Reducing Depending Libraries && Turning Off Backends

Plotters now supports use features to control the backend dependencies. By default, BitMapBackend and SVGBackend are supported, use default_features = false in the dependency description in Cargo.toml and you can cherry-pick the backend implementations.

  • svg Enable the SVGBackend
  • bitmap Enable the BitMapBackend

For example, the following dependency description would avoid compiling with bitmap support:

[dependencies]
plotters = { git = "https://github.com/38/plotters.git", default_features = false, features = ["svg"] }

The library also allows consumers to make use of the Palette crate's color types by default. This behavior can also be turned off by setting default_features = false.

List of Features

This is the full list of features that is defined by Plotters crate. Use default_features = false to disable those default enabled features, and then you should be able to cherry-pick what features you want to include into Plotters crate. By doing so, you can minimize the number of dependencies down to only itertools and compile time is less than 6s.

The following list is a complete list of features that can be opt in and out.

  • Tier 1 drawing backends
Name Description Additional Dependency Default?
bitmap_encoder Allow BitMapBackend save the result to bitmap files image, rusttype, font-kit Yes
svg_backend Enable SVGBackend Support None Yes
bitmap_gif Opt-in GIF animation Rendering support for BitMapBackend, implies bitmap enabled gif Yes
  • Font manipulation features
Name Description Additional Dependency Default?
ttf Allows TrueType font support rusttype, font-kit Yes
  • Coordinate features
Name Description Additional Dependency Default?
datetime Eanble the date and time coordinate support chrono Yes
  • Element, series and util functions
Name Description Additional Dependency Default?
errorbar The errorbar element support None Yes
candlestick The candlestick element support None Yes
boxplot The boxplot element support None Yes
area_series The area series support None Yes
line_series The line series support None Yes
histogram The histogram series support None Yes
point_series The point series support None Yes
  • Misc
Name Description Additional Dependency Default?
deprecated_items This feature allows use of deprecated items which is going to be removed in the future None Yes
debug Enable the code used for debugging None No

FAQ List

  • Why does the WASM example break on my machine ?

    The WASM example requires using wasm32 target to build. Using cargo build is likely to use the default target which in most of the case is any of the x86 target. Thus you need add --target=wasm32-unknown-unknown in the cargo parameter list to build it.

  • How to draw text/circle/point/rectangle/... on the top of chart ?

    As you may realized, Plotters is a drawing library rather than a traditional data plotting library, you have the freedom to draw anything you want on the drawing area. Use DrawingArea::draw to draw any element on the drawing area.

  • Where can I find the backend code ?

    Since Plotters 0.3, all drawing backends are independent crate from the main Plotters crate. Use the following link to find the backend code:

Comments
  • [BUG] Invalid Coordinate Range hangs program

    [BUG] Invalid Coordinate Range hangs program

    I was plotting a line with

    let mut chart = ChartBuilder::on(&root)
                .caption("Dark Energy Only", ("sans-serif", 50).into_font())
                .margin(5_u32)
                .x_label_area_size(30_u32)
                .y_label_area_size(30_u32)
                .build_cartesian_2d(age_of_universe * a0.powi(2)..0.0, 0.0_f64..1.0).unwrap();
    

    and the program hung. Took me a few minutes and some println! debugging to realize that I had range going from a positive f64 to 0.0_f64 in age_of_universe * a0.powi(2)..0.0.

    I haven't been using plotters very long so I don't know where else this may be relevant, but I think there should be some sort of check + panic/err if an invalid range is provided to a function.

    bug 
    opened by cavemanloverboy 14
  • A FORK TO CONTINUE THE DEVELOPMENT IS OPEN NOW

    A FORK TO CONTINUE THE DEVELOPMENT IS OPEN NOW

    Since the future of this repository is unclear I created a fork to continue the development as an interim solution. For now, the plan is to merge any changes into this repository eventually. If that doesn't work a permanent solution must be found.

    Pull requests are welcome!

    plot-rs/plotters

    You can also join the new plot-rs organization. Just send me a short message if you want to join.

    opened by AaronErhardt 14
  • integrate palette colors into plotters as a feature

    integrate palette colors into plotters as a feature

    ~~This PR attempts to replace the crates color implementations with the palette crate. I have removed the Palette traits and structures for now since their use was weird to me and i wasnt sure how to translate them properly. The readme is also not updated since i saw that you have a script for that but i wasnt sure how to use it.~~

    ~~This is obviously a breaking change since this changes the public api drastically in terms of using a new crates for colors.~~

    Focus has shifted, read comments.

    Fixes #19

    opened by Veykril 14
  • Project still maintained?

    Project still maintained?

    Hi,

    I am considering using this to plot some graphs, but I noticed that none of the pull requests of the last four-ish months have been merged. Is this project still actively being maintained?

    opened by kaimast 12
  • Add `ab_glyph` font backend

    Add `ab_glyph` font backend

    I've been using plotters in a situation where caring about system fonts is unimportant, and having font-kit in my dependency tree has been causing me unnecessary problems. This PR introduces a feature gated font rendering backend based on https://github.com/alexheretic/ab-glyph, which doesn't have those problems for me.

    I am willing to restructure or completely rewrite this code as necessary to get some form of this feature merged- I can't say I'm certain this is the best API for it. I can also, and probably should also, add documentation and tests for it. Lemme know what you think is best and I'll do it.

    opened by Monadic-Cat 12
  • [Feature Request] DrawingAreas should be threadsafe.

    [Feature Request] DrawingAreas should be threadsafe.

    Background

    Similar to #55. In addition, it would be nice to make use of multiple cores when rendering real time sub-graphs.

    • What is the feature ?

    When doing:

    let root = BitMapBackend::with_buffer(&mut texture.data, texture.dimension).into_drawing_area();
    let (upper, lower) = root.split_vertically(300);
    

    It would be nice if upper and lower could be used from separate threads to render both sub-graphs in parallel, since they should not share any overlapping area.

    • Why do you need the feature ?
    • What is the use case ?

    See above, to improve multi-core utilization when doing software rendering of real time graphs.

    Addition Information

    Plotters should not do the multithreading itself and should remain lightweight. Instead, I as the API user want to be in charge which threading library I use, e.g., when rendering sub-graphs.

    feature request 
    opened by ralfbiedert 12
  • Text anchor positions have been added.

    Text anchor positions have been added.

    A follow-up PR regarding text alignment. The main change is a new attribute added to the TextStyle - the text anchor position that specifies the position of the anchor point (used in draw_text) relative to the text itself. I had to dismiss my original idea to use rectangles as there is a Text element that is a Drawable, therefore need to draw itself using specified points. As a bonus, the current implementation is backward compatible.

    Unfortunately, completely get rid of the text size estimation isn't possible yet, therefore there are the use-cases there the text won't be properly aligned yet:

    • title as it uses the text height to adjust the drawing area;
    • series labels as they need to calculate the bound rectangle;
    • multiline text. The current implementation is not quite compatible with the client side rendering as rather the backend should calculate its layout, not the element itself (for example, SVG would need to utilize <tspan> tag for that).

    However, it doesn't affect the actual visible results so much (unless series labels border is visible) as all of those elements utilize the margins.

    Additional notes:

    • Now backends do all text transformations, no fonts themselves (as a side effect, the font draw code is much simpler now as no offsets calculations are needed). It affect multiline element rendering if rotated, however, it doesn't properly rotate even in the original code;
    • should_draw check is gone from axis drawing as we can't reliable determine the text bounds, so we utilize clipping for that now (verified and fixed for all backends). Also I guess that users prefer partially visible text than completely hidden. However, it would be nice to have support for mesh margins, so we could put some extra spacing thus avoiding clipping;
    • the rendering results changed for all examples, so I guess they need to be updated;
    • SVG for MS IE/Current Edge has issues because they don't support all tags from the spec. However, as Edge is switching to Chromium rendering engine, it won't be an issue in near future (I've verified with beta Edge). If it could be an issue, I can try to find some workarounds;
    • fixed draw_pixel in bitmap backend to normalize alpha as the animation example send overflowed float values to it.
    • console example have a gap now between bottom labels and the axis, but it's not because of the miscalculations, but rather because ticks are not drawn there (the draw_line function doesn't draw vertical lines with 1 pixel width).
    opened by nuald 10
  • [BUG] `into_coord_trans()` not supported for chrono::DateTime

    [BUG] `into_coord_trans()` not supported for chrono::DateTime

    Hello everyone! I am new to the crate and I encountered a little issue:

    Describe the bug When using a Chart with chrono::DateTime on the X axis, its not possible to use the into_coord_trans() function of the ChartContext.

    Trying to call the function gives the following error:

    the method `into_coord_trans` exists for struct `plotters::chart::ChartContext<'_, plotters_canvas::CanvasBackend, plotters::prelude::Cartesian2d<plotters::prelude::RangedDateTime<chrono::DateTime<chrono::FixedOffset>>, plotters::coord::types::RangedCoordf64>>`, but its trait bounds were not satisfied
    the following trait bounds were not satisfied:
    `plotters::prelude::Cartesian2d<plotters::prelude::RangedDateTime<chrono::DateTime<chrono::FixedOffset>>, plotters::coord::types::RangedCoordf64>: plotters::coord::ReverseCoordTranslate`
    

    To Reproduce I am using the Canvas Backend, here is a made up example to trigger the issue:

    use plotters::prelude::*;
    use plotters_canvas::CanvasBackend;
    
    
    #[allow(clippy::similar_names)]
    pub fn test_func(id: String) {
        let backend = CanvasBackend::new(&id).expect("cannot find canvas");
        let drawing_area = backend.into_drawing_area();
        drawing_area.fill(&WHITE);
    
        let time_0 = chrono::DateTime::parse_from_str(
            "1983 Apr 13 12:09:14.274 +0000",
            "%Y %b %d %H:%M:%S%.3f %z",
        )
        .unwrap();
        let time_1 = chrono::DateTime::parse_from_str(
            "1983 Apr 13 13:09:14.274 +0000",
            "%Y %b %d %H:%M:%S%.3f %z",
        )
        .unwrap();
        let time_2 = chrono::DateTime::parse_from_str(
            "1983 Apr 13 14:09:14.274 +0000",
            "%Y %b %d %H:%M:%S%.3f %z",
        )
        .unwrap();
        let times = vec![time_0, time_1, time_2];
    
        let chart_x_range = time_0..time_1;
        let chart_y_range = 0f64..2f64;
    
        let mut chart = ChartBuilder::on(&drawing_area)
            .margin(40i32)
            .caption::<&str, FontDesc>("Title", ("sans-serif", 20.0).into_font())
            .build_cartesian_2d(chart_x_range, chart_y_range)
            .unwrap();
        chart.configure_mesh().draw().unwrap();
    
        let data = times
            .iter()
            .enumerate()
            .map(|(index, x)| (*x, index as f64))
            .collect::<Vec<_>>();
        chart.draw_series(LineSeries::new(
            data.iter().map(|p| p.clone()),
            ShapeStyle {
                color: RGBAColor(255, 0, 0, 1.0),
                filled: true,
                stroke_width: 2,
            },
        ));
        drawing_area.present();
        let not_compiling = chart.into_coord_trans();
    }
    

    Version Information

    plotters = "0.3"
    plotters-canvas = "0.3"
    chrono = { version = "0.4", features = ["serde"]}
    

    Is there anything I made wrong, and if yes could you let me know? Or is it a bug?

    Thank you!

    bug 
    opened by vpochapuis 9
  • Improve font loading

    Improve font loading

    I have a relatively minimal Linux system with not a ton of fonts installed, which is probably the cause for this problem. However I cannot figure out for the life of me how to make any example of plotters work without modifications.

    It seems like by default it just doesn't work at all. I'm not sure what the default font is but that's already quite surprising. In general I feel like it should work on any system with at least some font installed.

    Running fc-match on any of the patterns I've tried will give me a good chunk of fonts to pick from, but things seem to only work out when specifying an exact font name.

    I'm a bit confused by this, since I've looked at some of the font-kit code and it's fairly similar to the font loader I've written (partially) myself. Is this fickle font loading solely due to font-kit, or does plotters actually load specific faces here?

    feature request 
    opened by chrisduerr 9
  • [BUG] Line point drawn outside of the graph

    [BUG] Line point drawn outside of the graph

    Describe the bug Hello,

    I have an issue where sometimes, a line point is rendered on the left, in the Y absis column, of the graph instead of the end of the serie. You can check out this video: https://blackyoup.cellar-c2.services.clever-cloud.com/plotters-off-by-one.mp4 starting at ~8 seconds, you can see a blue point rendered between the 0 and 50 Y absis.

    I've traced this a bit in the library and it seems like it's the last point of the serie that is drawn there. My image buffer is 758px width and 250px height and that's the same values that I give to the BitMapBackend: https://github.com/makers-for-life/makair/blob/5c8bb20cad9a9d1be4dde9c6a5c943c730891575/src/software/control/src/display/renderer.rs#L293

    From what I see by tracing the code, it seems like the X value of this point is supposed to be drawn at pixel 758 which is the same size as my image buffer. But IΒ find this value weird, to me, the image should only be drawn from pixel 0 to pixel 757, shouldn't it? This may be a side effect but if I replace this line https://github.com/38/plotters/blob/036520b9b8c30ae4f8b201f4c600bb62d05663b9/src/drawing/area.rs#L238 by (self.rect.x1 - self.rect.x0 - 1) as u32, the point doesn't render on the left.

    I wanted to have your input before attempting any fixes as I'm not really sure the problem comes from what IΒ described.

    Am I doing something wrong here or is an off-by-one issue?

    To Reproduce You can checkout the https://github.com/makers-for-life/makair/ repository, go into src/software/control and run cargo run -- -f ../telemetry/records/from_boot_with_fake_cycles_and_params_changes (some errors will pop up because this file is outdated but the bug triggers on it. It's not the same file as I made the video with)

    Version Information Plotters 0.2.12 and master

    Again, thanks a lot for your time :)

    bug 
    opened by BlackYoup 9
  • [BUG] `DrawingArea::fill` doesn't fill the right and bottom edge in some backends

    [BUG] `DrawingArea::fill` doesn't fill the right and bottom edge in some backends

    Describe the bug DrawingArea::fill doesn't fill the right and bottom edge in some backends and leaves transparent edges in a generated image. As far as I have checked, plotters-svg and plotters-canvas have this issue. BitMapBackend is fine about this.

    For CanvasBackend, it's quick to see #165's attached image. It continues in the latest code too.

    For SVGBackend, The repro code below prints this result. width and height in the rect element should be "100" here.

    <svg width="100" height="100" viewBox="0 0 100 100" xmlns="http://www.w3.org/2000/svg">
    <rect x="0" y="0" width="99" height="99" opacity="1" fill="#0000FF" stroke="none"/>
    </svg>
    

    Other backends with sub-pixel coordinate might have the same issue. Can be related to #128.

    To Reproduce

    use plotters::prelude::*;
    
    fn main() -> Result<(), Box<dyn std::error::Error>> {
        let mut content = String::new();
        {
            let area = SVGBackend::with_string(&mut content, (100, 100)).into_drawing_area();
            area.fill(&BLUE)?;
        }
        println!("{content}");
        Ok(())
    }
    

    Version Information plotters: current master (a72bfbced3523b17adc974ec7459f6c1c6f2d986) plotters-svg: current master (https://github.com/plotters-rs/plotters-svg/commit/47289e89a1078f330fcb6a3886b0ae34dc3f69e2) plotters-canvas: current master (https://github.com/plotters-rs/plotters-canvas/commit/111fce55a9ccc2999864358f991a28df6261f921)

    bug 
    opened by shinmili 8
  • Update ttf-parser requirement from 0.17.0 to 0.18.0

    Update ttf-parser requirement from 0.17.0 to 0.18.0

    Updates the requirements on ttf-parser to permit the latest version.

    Changelog

    Sourced from ttf-parser's changelog.

    [0.18.0] - 2022-12-25

    Added

    • Face::permissions
    • Face::is_subsetting_allowed
    • Face::is_bitmap_embedding_allowed
    • Face::unicode_ranges
    • os2::Table::permissions
    • os2::Table::is_subsetting_allowed
    • os2::Table::is_bitmap_embedding_allowed
    • os2::Table::unicode_ranges
    • name::Name::language
    • Language enum with all Windows languages.

    Changed

    • Using a non-zero index in Face::parse for a regular font will return FaceParsingError::FaceIndexOutOfBounds now. Thanks to Pietrek14.

    [0.17.0] - 2022-09-28

    Added

    Fixed

    • (CFF) Fix large tables parsing.

    [0.16.0] - 2022-09-18

    Added

    • CFF Encoding support.
    • cff::Table::glyph_index
    • cff::Table::glyph_index_by_name
    • cff::Table::glyph_width
    • cff::Table::number_of_glyphs
    • cff::Table::matrix
    • post::Table::glyph_name
    • post::Table::glyph_index_by_name
    • post::Table::names
    • Face::glyph_index_by_name
    • RawFace fields and TableRecord struct are public now.

    Changed

    • Face::from_slice was replaced by Face::parse.
    • RawFace::from_slice was replaced by RawFace::parse.
    • post::Table::names is a method and not a field now.
    • Use post::Table::glyph_name instead of post::Table::names.get().

    Fixed

    • (hmtx/vmtx) Allow missing additional side bearings.
    • (loca) Allow incomplete table.
    • Reduce strictness of some table length checks.
    • (post) post::Names::len was returning a wrong value. Now this method is gone completely.

    ... (truncated)

    Commits
    • a38c74f Version bump.
    • 2387bfc Add Language enum with all Windows languages.
    • e18327c Version bump.
    • 2b0e0e5 (OS/2) Parse permissions and Unicode ranges.
    • d9e71a1 Treat regular font as a one element collection when parsing.
    • See full diff in compare view

    Dependabot will resolve any conflicts with this PR as long as you don't alter it yourself. You can also trigger a rebase manually by commenting @dependabot rebase.


    Dependabot commands and options

    You can trigger Dependabot actions by commenting on this PR:

    • @dependabot rebase will rebase this PR
    • @dependabot recreate will recreate this PR, overwriting any edits that have been made to it
    • @dependabot merge will merge this PR after your CI passes on it
    • @dependabot squash and merge will squash and merge this PR after your CI passes on it
    • @dependabot cancel merge will cancel a previously requested merge and block automerging
    • @dependabot reopen will reopen this PR if it is closed
    • @dependabot close will close this PR and stop Dependabot recreating it. You can achieve the same result by closing it manually
    • @dependabot ignore this major version will close this PR and stop Dependabot creating any more for this major version (unless you reopen the PR or upgrade to it yourself)
    • @dependabot ignore this minor version will close this PR and stop Dependabot creating any more for this minor version (unless you reopen the PR or upgrade to it yourself)
    • @dependabot ignore this dependency will close this PR and stop Dependabot creating any more for this dependency (unless you reopen the PR or upgrade to it yourself)
    dependencies 
    opened by dependabot[bot] 0
  • Make error type 'static.

    Make error type 'static.

    This pull request makes the drawing backend error type 'static which makes returning errors more pleasant. Currently the draw_chart function was not callable if this was not the case any ways.

    fn some_func<DB>(
        area: &DrawingArea<DB, plotters::coord::Shift>,
      ) -> Result<(), Box<dyn std::error::Error>>
      where
        DB: DrawingBackend,
        // DB::ErrorType: 'static, not necessary any more, not very intuitive
      {
        let mut chart = ChartBuilder::on(area)
          .margin(10)
          .x_label_area_size(30)
          .y_label_area_size(30)
          .build_cartesian_2d(-1_f64..1_f64, -1_f64..1_f64)?;
        chart.configure_mesh().x_labels(20).y_labels(20).draw()?;
        Ok(())
      }
    
    opened by raldone01 1
  • Image dependency was upgraded in semver patch update (0.3.1->0.3.2)

    Image dependency was upgraded in semver patch update (0.3.1->0.3.2)

    In https://github.com/plotters-rs/plotters/pull/362, the image dependency was bumped from 0.23 to 0.24, which is a breaking update. Plotters exposes the image API, for example in the From implementation of BitMapElement, so the image dependency bump was a breaking change for plotters as well. However, plotters published this change in a semver patch release (0.3.2).

    I discovered this by updating my dependencies with cargo update and encountering an unexpected error:

    Screenshot_20221121_104125

    This confused me for about 10min until I figured out the unexpected breaking change.

    This issue serves as a FYI so that accidental breaking changes happen less often, hopefully. Feel free to close whenever deemed fit.

    bug 
    opened by kangalioo 0
  • [BUG] Data outside the plot area gets plotted at the edge instead of clipped

    [BUG] Data outside the plot area gets plotted at the edge instead of clipped

    When data occurs outside the plot area, it gets plotted on the edge of the plot area. I would expect it to be clipped and not visible at all. For e.g. PointSeries this can be worked around easily by removing the out-of-bounds points ahead of time, but for e.g. LineSeries it can be more problematic. The example below shows in red what plotters currently does, and the expected result in blue. Notice that even the lines within the boundary are drawn incorrectly because they connect to the shifted x=0 point.

    use plotters::prelude::*;
    
    fn main() -> Result<(), Box<dyn std::error::Error>> {
        let root = BitMapBackend::new("/tmp/test.png", (640, 480)).into_drawing_area();
        root.fill(&WHITE)?;
        let mut chart = ChartBuilder::on(&root)
            .margin(5)
            .x_label_area_size(30)
            .y_label_area_size(30)
            .build_cartesian_2d(-1f32..1f32, 0.2f32..1f32)?;
    
        chart.configure_mesh().draw()?;
    
        // Normal line plot
        chart
            .draw_series(LineSeries::new(
                (-2..=2).map(|x| x as f32 / 2.0).map(|x| (x, x * x)),
                ShapeStyle::from(RED).stroke_width(8),
            ))?;
    
        // Manually creating the expected result
        chart
            .draw_series(LineSeries::new(
                [(-1.0, 4.0), (-0.5, 0.25), (-f32::sqrt(0.2), 0.0)],
                ShapeStyle::from(BLUE).stroke_width(3),
            ))?;
        chart
            .draw_series(LineSeries::new(
                [(f32::sqrt(0.2), 0.0), (0.5, 0.25), (1.0, 4.0)],
                ShapeStyle::from(BLUE).stroke_width(3),
            ))?;
    
        root.present()?;
    
        Ok(())
    }
    

    bug 
    opened by jbncode 0
  • [BUG] - unresolved import `plotters_bitmap`

    [BUG] - unresolved import `plotters_bitmap`

    Describe the bug Unable to build plotters in another project that is using it.

    To Reproduce git clone https://github.com/diem/diem.git cargo install --path shuffle/cli

    Error

       Compiling plotters v0.3.3
    error[E0432]: unresolved import `plotters_bitmap`
     --> /root/.cargo/registry/src/github.com-1ecc6299db9ec823/plotters-0.3.3/src/evcxr.rs:4:5
      |
    4 | use plotters_bitmap::BitMapBackend;
      |     ^^^^^^^^^^^^^^^ use of undeclared crate or module `plotters_bitmap`
    

    Version Information Ubuntu 20.04

    bug 
    opened by 0xzoz 2
Data plotting library for Rust

plotlib plotlib is a generic data visualisation and plotting library for Rust. It is currently in the very early stages of development. It can current

Matt Williams 417 Dec 31, 2022
A simple 2D plotting library that outputs graphs to SVG that can be styled using CSS.

Poloto graphs can be stylized using css either directly in the SVG, or from inside of html with an embedded svg. The latter allows the user to dynamically match the svg to their website's theme.

Ken Reed 119 Dec 13, 2022
Render farm simulator & plotting for optimisation written in Rust.

Farm Usage Simulator Given a few basic charasteristics of a render farm and render jobs this app runs a few randomized farm usage scenarios and plots

ford 2 Jul 17, 2022
Externalize easily the plotting process from Rust to gnuplot.

preexplorer Easy plotter and saver of simple data. Handy tool for development stage or small computational projects. Save data, have a quick view and

Raimundo Saona 4 Jan 7, 2022
A Rust library for drawing plots, powered by Gnuplot.

RustGnuplot A Gnuplot controller written in Rust. Documentation See here Examples A simple example: let mut fg = Figure::new(); fg.axes2d() .set_titl

null 353 Dec 26, 2022
Vector is a high-performance, end-to-end (agent & aggregator) observability data pipeline that puts you in control of your observability data

Quickstart β€’ Docs β€’ Guides β€’ Integrations β€’ Chat β€’ Download What is Vector? Vector is a high-performance, end-to-end (agent & aggregator) observabilit

Vector 12.1k Jan 2, 2023
A library of to show data (in browser, evcxr_jupyter) as table, chart...

showata A library of to show data (in browser, evcxr_jupyter) as table, chart.... The crate provides display for: image vector and slice (as table) nd

Procyon 20 Dec 12, 2022
below is an interactive tool to view and record historical system data.

A time traveling resource monitor for modern Linux systems

Facebook Incubator 824 Dec 31, 2022
πŸ“ Web-based, reactive Datalog notebooks for data analysis and visualization

?? Web-based, reactive Datalog notebooks for data analysis and visualization

Eric Zhang 486 Dec 28, 2022
binocle is a graphical tool to visualize binary data

a graphical tool to visualize binary data

David Peter 773 Dec 30, 2022
A pure Rust visualization library inspired by D3.js

charts A pure Rust visualization library inspired by D3.js. See gallery and examples for code and more charts. Install You can add this as a dependenc

Iulian Gulea 186 Dec 29, 2022
A library to generate syntax diagrams for Rust macros.

Live demo (code) A browser add-on for Firefox, Chrome and Edge A library to generate syntax ("railroad") diagrams for Rust's macro_rules!(). Diagrams

null 468 Jan 6, 2023
A small charting/visualization tool and partial vega implementation for Rust

Gust A charting library for rust! Disclaimer This is still very much a work in progress! APIs are very unstable and subject to change. Contributions a

Samuel Resendez 128 Dec 24, 2022
Swash is a pure Rust, cross-platform crate that provides font introspection, complex text shaping and glyph rendering.

Swash is a pure Rust, cross-platform crate that provides font introspection, complex text shaping and glyph rendering. Goals This crate aims to

Chad Brokaw 398 Dec 14, 2022
Plotly for Rust

Plotly.rs Plotly for Rust Getting Started | Recipes | API Docs | Changelog | | | A plotting library for Rust powered by Plotly.js. Usage Add this to y

Ioannis Giagkiozis 671 Jan 8, 2023
This is a Rust implementation of a boid flocking simulation using the ggez graphics crate.

Boidflock This is a Rust implementation of a boid flocking simulation using the ggez graphics crate. The CLI for this program is built using the struc

Andrew Lee 12 Jan 4, 2023
Rust crate for creating beautiful interactive Chord Diagrams

Chord PRO Released Chord PRO is the full-featured chord visualization API, producing beautiful interactive visualizations, e.g. those featured on the

Dr. Shahin Rostami 25 Sep 10, 2022
A Rust API for Vega-Lite V4 to build chart with a rusty API.

Vega-Lite V4 for Rust A Rust API for Vega-Lite V4 to build chart with a rusty API. Similar to the Altair project in python, this crate build upon Vega

Procyon 18 Nov 26, 2022