Render farm simulator & plotting for optimisation written in Rust.

Overview

Farm Usage Simulator

Given a few basic charasteristics of a render farm and render jobs this app runs a few randomized farm usage scenarios and plots the results. You can use this to help tweak your render farm and job settings to save time and money.

usage

The app is written in Rust. You'll need Rust installed. Once you have it, build the project and run the binary:

# in the repo root containing the "src" dir.
$ cargo b --release
...

# move the binary here from the build dir for convenience...
$ mv target/release/farmsim .

# run
$ ./farmsim

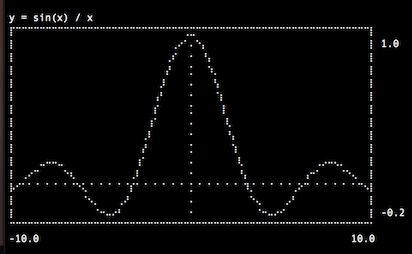
On the first use the app will save the default config file in the current directory. the config file is called: farmsimconf.json. Update the values and run the app again, every run saves a png image of the farm usage statistics with the current configuration.

  • The plot png file is called: farm_usage_plot.png and it's 1600 x 900 pixels.
  • After the 1st run saved the config json, you can update it and render the sims again.
  • The files are overwritten. If you want to keep one, rename the file.
  • The black lines are farm utilisation in %.
  • The green line is finished jobs % of the total jobs initially submitted.

The default config runs in ~0.2 second on a pentium cpu.

default config

tweak the config, save the file, analyse the results:

The next few sims show 10 sims of 1600 cycles. The config is 500 cpus, 100 randomised jobs submitted. According to the results after only tweaking the chunk size, starting with 500 cpus finishing on average after ~1000 cycles you can save 300 cpus and finish on average after ~900 cycles.*

* This is a Rust R'n'D hobby project. There can be any number of mistakes in the calculations.

default config default config default config default config

Config

Frames rendering doesn't last in term of time. The sim works with cycles. Timing is based on proportions, duration is a multiplier of cycles. A job has a configurable, randomised start up and render time. How long a frame renders, how long it takes to open up a scene and start a render is all specified in cycles. Like a job with one 1 hour frame takes just as long as a job with 6 frames that take 10 minutes to render each. Configure these in min, max ranges and each job gets a random value within the range for every sim.

If you think of a cycle as a minute, you'll get all times in minutes. Like, given the farm is empty, 1 job with 10 frames, 5 chunk size -> meaning 2 tasks with 5 frames, 1 minute startup and 1 minute per frame render time => 2 times 6 minutes jobs. On one cpu it takes 12 minutes, on 2 cpus it's 6 minutes.

  • repetitions: Number of sims to run.
  • max_cycles: Number of cycles to run max. The sim finishes early when all the jobs finish.
  • cpus: Number of CPUs (blades?) on the farm.
  • job_count: Number of submitted jobs when the sim starts. A sim runs with this initial state, no new jobs are submitted and the sim shows how those jobs render.
  • min_frames: random job frame range min lenght
  • max_frames: random job frame range max lenght
  • min_chunk_size: random job chunk size range min
  • max_chunk_size: random job chunk size range max
  • min_frame_cycles: min random number of cycles of rendering a frame
  • max_frame_cycles: max random number of cycles of rendering a frame
  • min_startup_cycles: min random number of cycles of opening a scene befor starting a chunk render
  • max_startup_cycles: max random number of cycles of opening a scene befor starting a chunk render

config values with ranges are randomised per job, per sim.

You might also like...
Rust crate for creating beautiful interactive Chord Diagrams

Chord PRO Released Chord PRO is the full-featured chord visualization API, producing beautiful interactive visualizations, e.g. those featured on the

A Rust API for Vega-Lite V4 to build chart with a rusty API.

Vega-Lite V4 for Rust A Rust API for Vega-Lite V4 to build chart with a rusty API. Similar to the Altair project in python, this crate build upon Vega

A pure Rust visualization library inspired by D3.js

charts A pure Rust visualization library inspired by D3.js. See gallery and examples for code and more charts. Install You can add this as a dependenc

A library to generate syntax diagrams for Rust macros.

Live demo (code) A browser add-on for Firefox, Chrome and Edge A library to generate syntax ("railroad") diagrams for Rust's macro_rules!(). Diagrams

Graphical Rust program that uses a fractal algorithm to draw a tree of sorts

rusty-vegetation Graphical Rust program that uses a fractal algorithm to draw a "tree" of sorts. To Build and Run On Linux: Install build-essentials o

A Rust program for visualizing how sections get packed into your Game Boy ROM

GB Packing Visualizer A Rust program for visualizing how sections get packed into your Game Boy ROM. rhythm_land.mp4 Each column represents a ROM bank

Lightweight graphs (sparklines) for use with Embedded Rust

Sparklines for Rust's Embedded-graphics Sparklines are small, high resolution graphics embedded in a context of words, numbers or images". Edward Tuft

Using bevy and custom render pipelines in order to render many objects in a forest using chunks for performance.

bevy_efficient_forest_example Using bevy and custom render pipelines in order to render many objects in a forest using chunks for performance. Grass i

Easy c̵̰͠r̵̛̠ö̴̪s̶̩̒s̵̭̀-t̶̲͝h̶̯̚r̵̺͐e̷̖̽ḁ̴̍d̶̖̔ ȓ̵͙ė̶͎ḟ̴͙e̸̖͛r̶̖͗ë̶̱́ṉ̵̒ĉ̷̥e̷͚̍ s̷̹͌h̷̲̉a̵̭͋r̷̫̊ḭ̵̊n̷̬͂g̵̦̃ f̶̻̊ơ̵̜ṟ̸̈́ R̵̞̋ù̵̺s̷̖̅ţ̸͗!̸̼͋

Rust S̵̓i̸̓n̵̉ I̴n̴f̶e̸r̵n̷a̴l mutability! Howdy, friendly Rust developer! Ever had a value get m̵̯̅ð̶͊v̴̮̾ê̴̼͘d away right under your nose just when

🌱 Easy to use, blazing-fast, and reliable Chia plot manager for your farm

🚧 🚧 🚧 🚧 🚧 🚧 🚧 🚧 🚧 🚧 🚧 🚧 🚧 🚧 🚧 🚧 🚧 🚧 🚧 🚧 🚧 🚧 🚧 🚧 🚧 🚧 🚧 🚧 🚧 🚧 🚧 🚧 🚧 🚧 🚧 🚧 🚧 🚧 🚧 🚧 🚧 🚧 🚧 🚧 🚧 UNDER DEVELOPME

Tests + experiments that aim to answer questions of optimisation + what's possible w/ Rust.

rust-experiments Resources TheDevMethod: Rust YT tutorials Introduction to Rust - Part 15: Futures How to use Mutex and Atomically Reference Counted A

Gm microoptimisation war crime - An experimental optimisation for Garry's Mod

Wat This attractively named repository contains a Garry's Mod module that performs a micro optimisation that makes use of LuaJIT's constant folding on

Noir Pay - Fork of the Light Protocol Program for local testing / optimisation.

Noir Pay v0 Built on Light Protocol Noir Pay will be directly built ontop of the Light Protocol SDK and provide users with a beautifully simple privat

Data plotting library for Rust

plotlib plotlib is a generic data visualisation and plotting library for Rust. It is currently in the very early stages of development. It can current

A rust drawing library for high quality data plotting for both WASM and native, statically and realtimely 🦀 📈🚀

Plotters - A Rust drawing library focus on data plotting for both WASM and native applications 🦀 📈 🚀 Plotters is drawing library designed for rende

#creativecoding Plotting done with rust – published on Twitter @greweb with #plottingtwitter

Similarly to "One day, One shader" ( https://github.com/gre/shaderday.com ), this Rust project is a "generative art" that, for each entry in examples/

Terminal plotting library for using in Rust CLI applications

textplots Terminal plotting library for using in Rust CLI applications. Should work well in any unicode terminal with monospaced font. It is inspired

Externalize easily the plotting process from Rust to gnuplot.

preexplorer Easy plotter and saver of simple data. Handy tool for development stage or small computational projects. Save data, have a quick view and

A simple 2D plotting library that outputs graphs to SVG that can be styled using CSS.

Poloto graphs can be stylized using css either directly in the SVG, or from inside of html with an embedded svg. The latter allows the user to dynamically match the svg to their website's theme.

Owner
ford
ford
Data plotting library for Rust

plotlib plotlib is a generic data visualisation and plotting library for Rust. It is currently in the very early stages of development. It can current

Matt Williams 417 Dec 31, 2022
A rust drawing library for high quality data plotting for both WASM and native, statically and realtimely 🦀 📈🚀

Plotters - A Rust drawing library focus on data plotting for both WASM and native applications ?? ?? ?? Plotters is drawing library designed for rende

Hao Hou 2.7k Jan 4, 2023
Externalize easily the plotting process from Rust to gnuplot.

preexplorer Easy plotter and saver of simple data. Handy tool for development stage or small computational projects. Save data, have a quick view and

Raimundo Saona 4 Jan 7, 2022
A simple 2D plotting library that outputs graphs to SVG that can be styled using CSS.

Poloto graphs can be stylized using css either directly in the SVG, or from inside of html with an embedded svg. The latter allows the user to dynamically match the svg to their website's theme.

Ken Reed 119 Dec 13, 2022
A small charting/visualization tool and partial vega implementation for Rust

Gust A charting library for rust! Disclaimer This is still very much a work in progress! APIs are very unstable and subject to change. Contributions a

Samuel Resendez 128 Dec 24, 2022
Plotly for Rust

Plotly.rs Plotly for Rust Getting Started | Recipes | API Docs | Changelog | | | A plotting library for Rust powered by Plotly.js. Usage Add this to y

Ioannis Giagkiozis 671 Jan 8, 2023
This is a Rust implementation of a boid flocking simulation using the ggez graphics crate.

Boidflock This is a Rust implementation of a boid flocking simulation using the ggez graphics crate. The CLI for this program is built using the struc

Andrew Lee 12 Jan 4, 2023
A Rust library for drawing plots, powered by Gnuplot.

RustGnuplot A Gnuplot controller written in Rust. Documentation See here Examples A simple example: let mut fg = Figure::new(); fg.axes2d() .set_titl

null 353 Dec 26, 2022
Swash is a pure Rust, cross-platform crate that provides font introspection, complex text shaping and glyph rendering.

Swash is a pure Rust, cross-platform crate that provides font introspection, complex text shaping and glyph rendering. Goals This crate aims to

Chad Brokaw 398 Dec 14, 2022