textplots 

Terminal plotting library for using in Rust CLI applications. Should work well in any unicode terminal with monospaced font.
It is inspired by TextPlots.jl which is inspired by Drawille.
Currently it features only drawing line charts on Braille canvas, but could be extended to support other canvas and chart types just like UnicodePlots.jl or another cool terminal plotting library.
Contributions are very much welcome!
Usage
Using as a library
use textplots::{Chart, Plot, Shape};
fn main() {
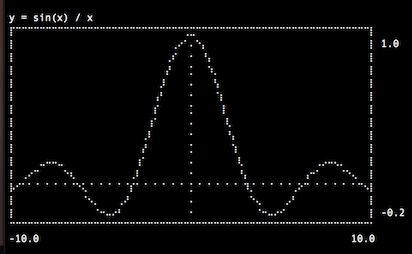
println!("y = sin(x) / x");
Chart::default()
.lineplot(&Shape::Continuous(Box::new(|x| x.sin() / x)))
.display();
}
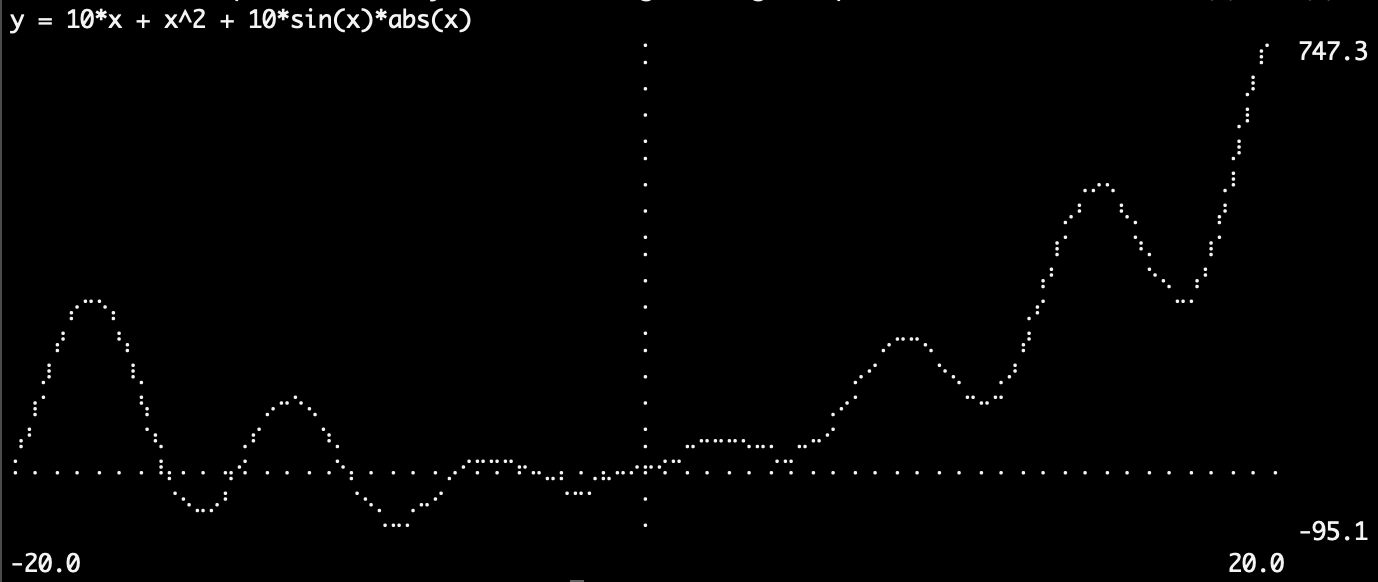
Using as a binary
$ textplots '10*x + x^2 + 10*sin(x)*abs(x)' --xmin=-20 --xmax=20
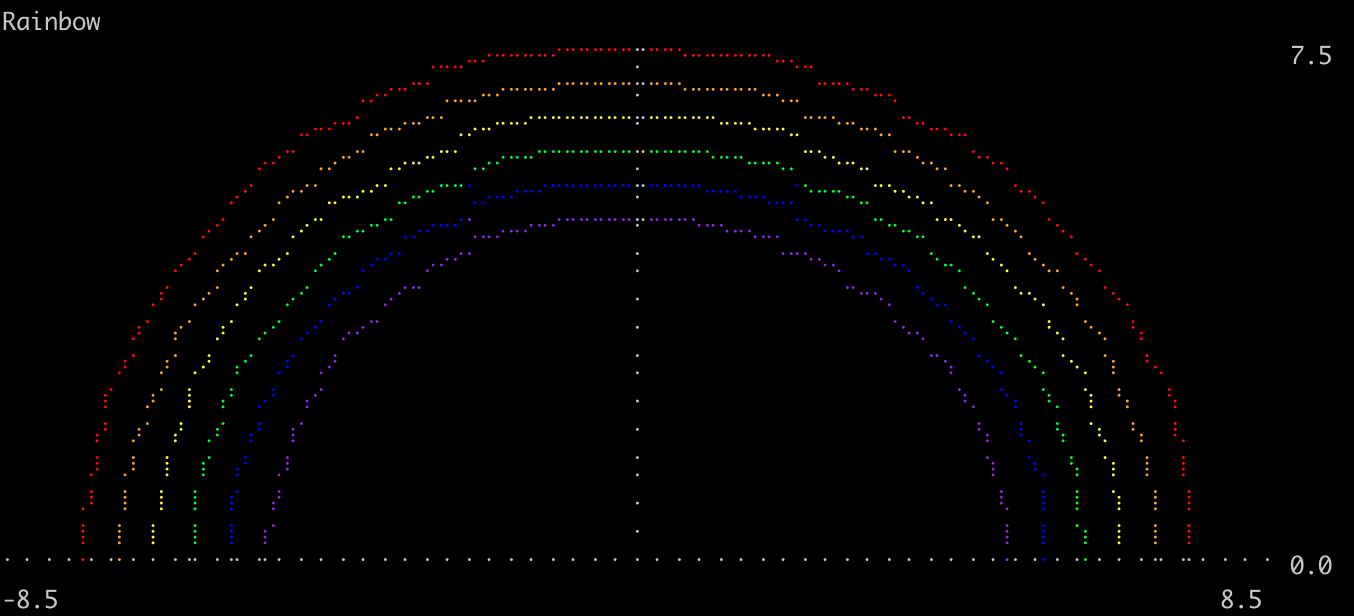
Bonus! Colored plots (see examples)


 18 Jul 3, 2021
 132 Dec 14, 2022
 166 Dec 18, 2022
 3 Jan 21, 2022
 6 May 10, 2023
 36 May 8, 2023
 5 Jun 20, 2023
 16 Mar 10, 2024
 22 Nov 20, 2022
 8 Sep 16, 2024
 5 Nov 9, 2022
 18 Oct 24, 2022
 2 Mar 2, 2022
 102 Feb 18, 2023
 5 Mar 14, 2023
 70 Apr 14, 2023
 9 May 30, 2023
 5 Jun 12, 2023
 3 Sep 29, 2023