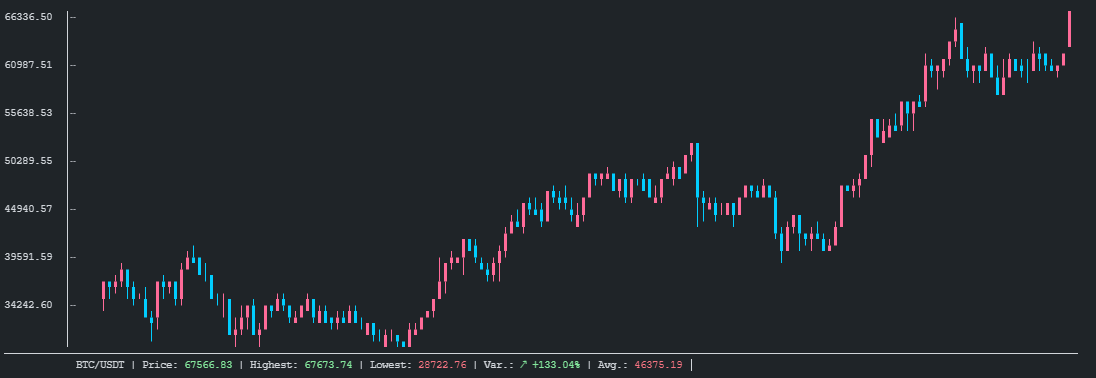
cli-candlestick-chart
This module allows you to display candle charts directly in your terminal.
I did this project mainly to learn Rust, so the code is may be not very good at some places.
Usage
Add this to your Cargo.toml
[dependencies]
cli-candlestick-chart = "0.1"
use cli_candlestick_chart::{Candle, Chart};

fn main() {
    // Add some candles
    let candles: Vec<Candle> = vec![
        Candle::new(133.520004, 133.610001, 126.760002, 129.410004),
        Candle::new(128.889999, 131.740005, 128.429993, 131.009995),
        Candle::new(127.720001, 131.050003, 126.379997, 126.599998),
        Candle::new(128.360001, 131.630005, 127.860001, 130.919998),
        Candle::new(132.429993, 132.630005, 130.229996, 132.050003),
        Candle::new(129.190002, 130.169998, 128.500000, 128.979996),
        Candle::new(128.500000, 129.690002, 126.860001, 128.800003),
        Candle::new(128.759995, 131.449997, 128.490005, 130.889999),
        Candle::new(130.800003, 131.000000, 128.759995, 128.910004),
        Candle::new(128.779999, 130.220001, 127.000000, 127.139999),
        Candle::new(127.779999, 128.710007, 126.940002, 127.830002),
        Candle::new(128.660004, 132.490005, 128.550003, 132.029999),
        Candle::new(133.800003, 139.669998, 133.589996, 136.869995),
        Candle::new(136.279999, 139.850006, 135.020004, 139.070007),
        Candle::new(143.070007, 145.089996, 136.539993, 142.919998),
        Candle::new(143.600006, 144.300003, 141.369995, 143.160004),
        Candle::new(143.429993, 144.300003, 140.410004, 142.059998),
        Candle::new(139.520004, 141.990005, 136.699997, 137.089996),
        Candle::new(135.830002, 136.740005, 130.210007, 131.960007),
        Candle::new(133.750000, 135.380005, 130.929993, 134.139999),
    ];

    // Create and display the chart
    let mut chart = Chart::new(candles);

    // Set the chart title
    chart.set_name(String::from("BTC/USDT"));

    // Set customs colors
    chart.set_bear_color(1, 205, 254);
    chart.set_bull_color(255, 107, 153);

    chart.draw();
}


