Lemmy (Stats) Data Exporter
About This Project
This project aims to act as a bridge between Lemmy's PostgreSQL database and InfluxDB, primarily to track various metrics that might be important to instance administrators. It is intended to be used with Grafana however you're more than welcome to of course use the data on your favorite Influx-consuming-mechanism.
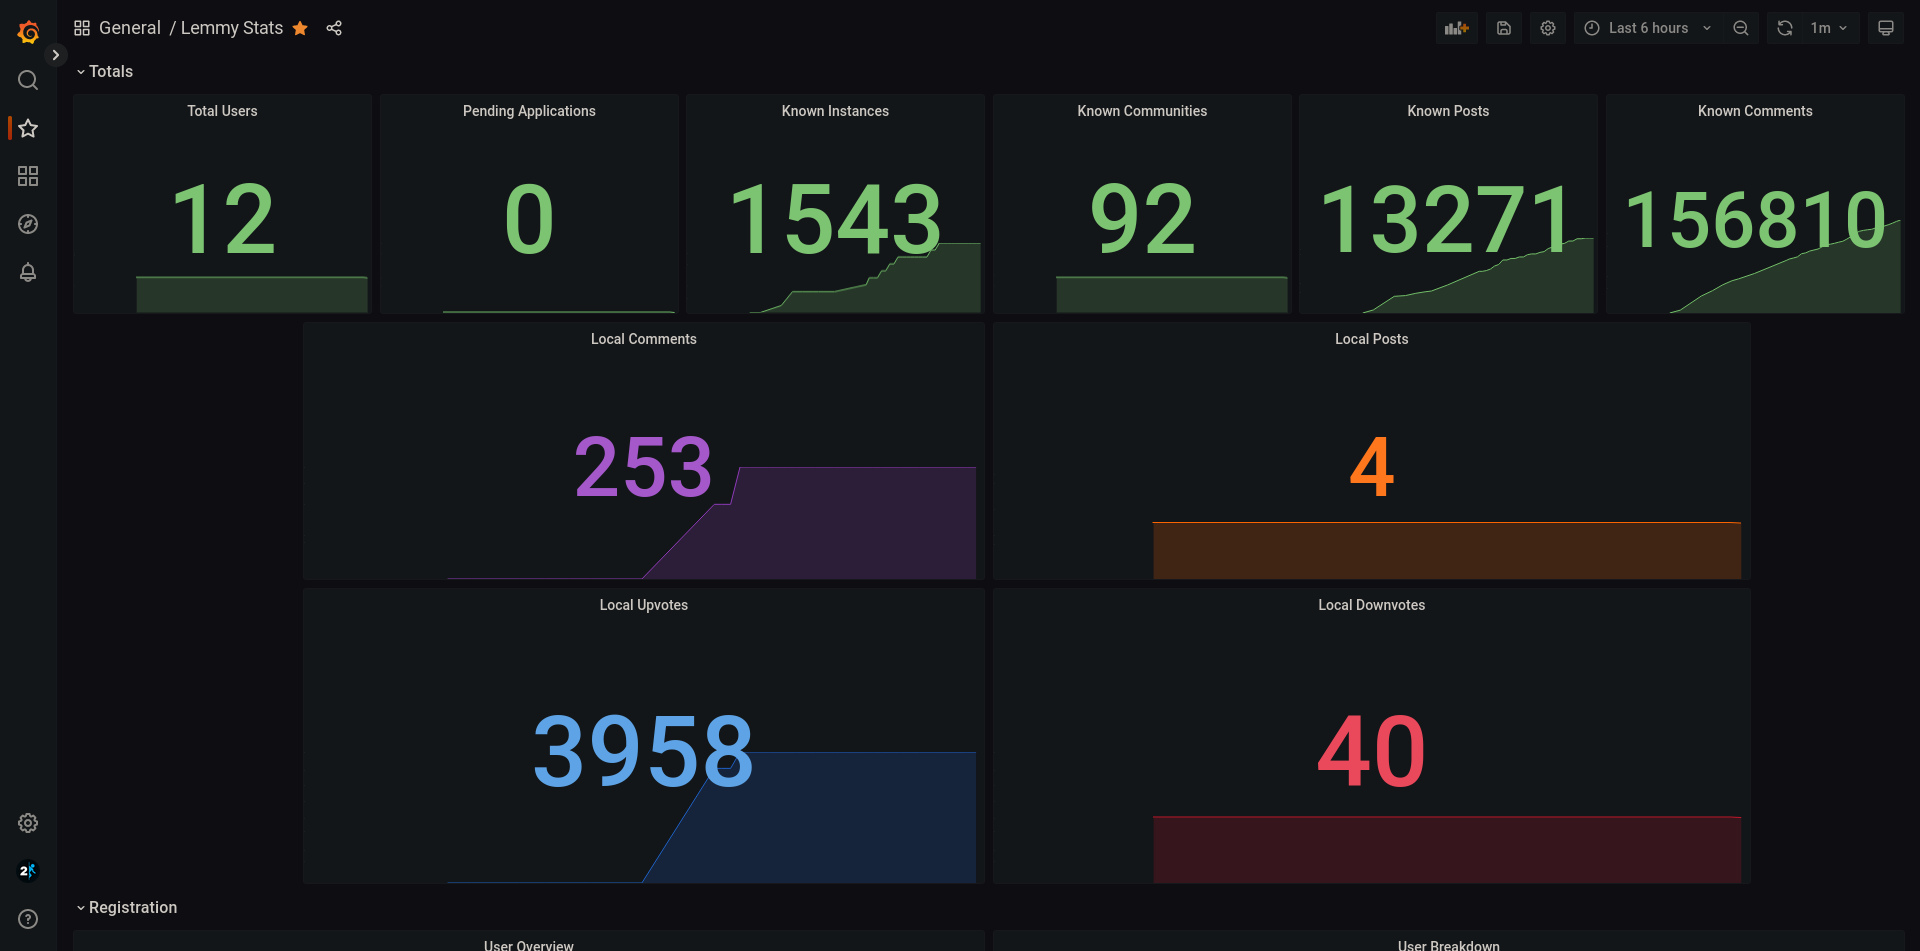
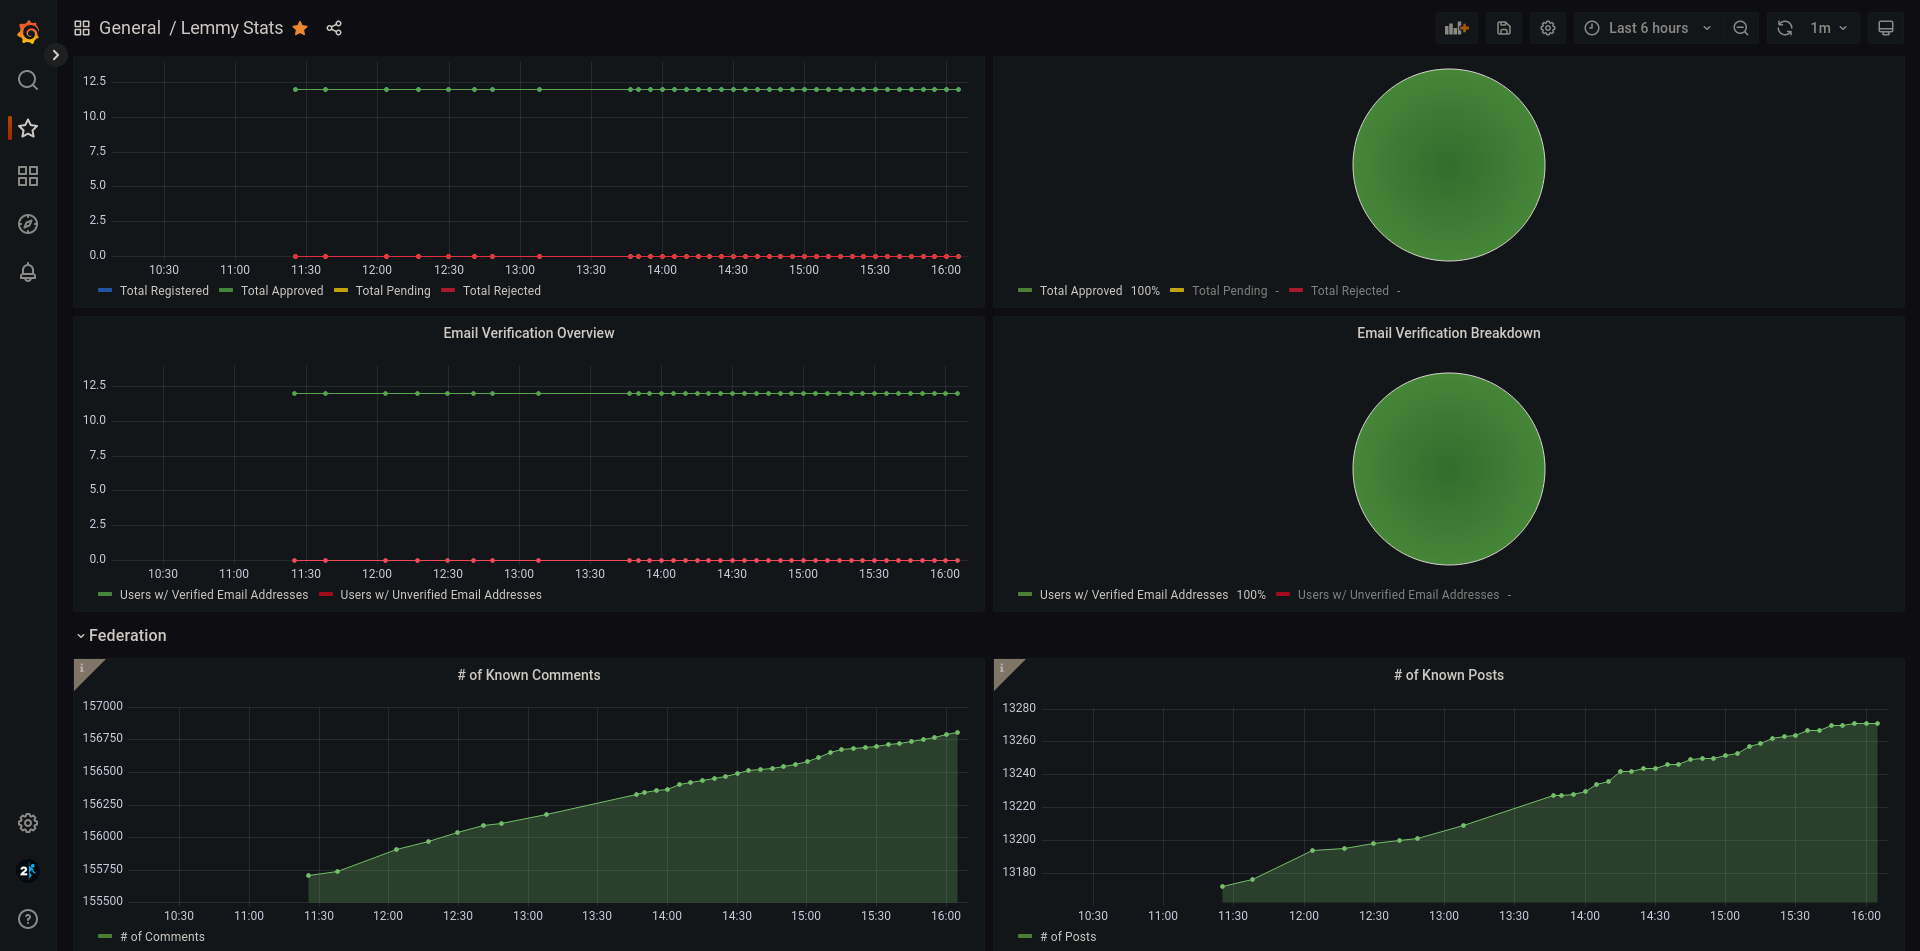
You can preview what the final result looks like here - since its a "snapshot" version, some components might look a bit off (such as a "Page not found" title, and the "email verification breakdown" panel for some reason - which is the same type of panel as "User Breakdown", with the same data from "Email Verification Overview").
Motivations
I've built this project because I want to be a responsible Lemmy instance administrator. The Fediverse (Wikipedia) relies on trust between instance administrators to keep their instances clean. As of the current time of writing, Lemmy doesn't really have too many tools built-in to audit what is occurring on your instance. However, the data is certainly there, in its PostgreSQL database! However, no one wants to really be stuck at the psql command line (or well, I certainly don't) so I figured if I had a way to visualize the data, then it would give me an easy way to keep tabs on my Lemmy instance.
Also, I've been wanting to get a better grasp on Rust (the codebase may reflect this...) - which happens to also be the same backend language that Lemmy uses! At the same time, aside from a premade dashboard here and there, I've never made my own Grafana dashboard (or interacted with InfluxDB for that matter) so this project gave me quite a few different topics to learn from.
The spirit of the Fediverse is all about being open, so of course I'm happy to share this project with anyone whose interested!
Sounds Great! Where do I get started?
Before we get to the good part, if you'll just allow me a quick disclaimer:
Please utilize this tool responsibly, and carefully. I'm sure I do not need to give instance admins the usual "backup your stuff!" talk, but please - make sure you have backups of any important data. There are no plans for this tool to use anything other than SELECT queries with the database, but who knows, maybe a cosmic ray hits your system and flips a bit causing that SELECT to turn into a DELETE... okay, that can't actually happen for numerous reasons - but still, please take backups. You should be doing that anyways!
Requirements
To utilize this project as intended, you'll need the following:
- Administrative access to the system running your Lemmy instance (or at least, its PostgreSQL database)
- An InfluxDB server (its very lightweight, I promise!)
- My instance uses version 1.8.9 whereas 2.x is the newest version, from my understanding v1.8.x has forward-compatibility with 2.x's APIs which should mean that the Rust library I'm using for this project should work on both versions, but if it doesn't, I apologize! Let me know and I can try to see what can be done to remedy that.
- The following libraries should be present in your system's
/usr/libfolder:libgcc_s.so.1libm.so.6libc.so.6- Note: This should be present on modern Linux systems. My machine runs Arch Linux, but my VM that runs Lemmy uses Ubuntu 22.04 and the required libraries are there.
- Did I mention backups?
- Some method to consume this data, such as a Grafana instance (self-hosted is what I've tested this with, but I believe Grafana's devs do offer Grafana-as-a-Service as well)
- (If compiling from source) A fairly recent version of Rust-stable (I built this project with 1.69.0)
Compiling from Source
Whenever you want to utilize a tool that is built by someone else to interact with a piece of software you're running, I find it a good idea to audit the source code of the project (even if you don't know Rust, you can take a look at the SQL queries that are made in src/main.rs) and build it from source. As such, I'm going to place this section first - its easy anyways!
As mentioned above, you'll need a recent version of Rust-stable's toolchain to be installed. My favorite method for installing Rust is with Rustup, as if you choose to install it from your distribution's package manager, you may end up getting an older version (I've been bitten by this in the past personally...) - speaking of which, you can try to compile this on Windows or macOS, I don't see why it wouldn't work but I've not personally tried it myself.
Then, clone this repository somewhere, and run the cargo build --release command. You'll then have a handy binary over at target/lemmy-data-exporter!
Preparation
Whether you've compiled the project from source, or downloaded a binary from the releases section then we're almost ready to go!
If you haven't already, you'll need to create an Influx database for your metrics/stats to go into. While providing instructions on installing InfluxDB is out of scope for this guide, that link should get you started! Once you have InfluxDB up and running, you should be able to connect to your instance with the influx command run create database YOUR_DB_NAME_HERE (the name of the database doesn't matter, but keep note of it somewhere).
Additionally, if you haven't already you'll need to make sure that your Lemmy's PostgreSQL instance is available to connect to from the system that you're running this utility on... Speaking of which, a couple of more disclaimers before we proceed:
NOTE:
- InfluxDB doesn't have authentication enabled by default, and this tool also assumes that you haven't gone and enabled authentication - so please make sure that Influx's ports (by default these should be
8086and8089) whether you firewall off the ports or are running this all on a VM that doesn't have external/public access... Technically this tool doesn't export any sensitive data to Influx, but you still don't want to offering free Influx hosting for any random person who happens to do a port-scan on your IP. - Additionally, the next step is about to advise you to adjust your Lemmy configuration to expose the PostgreSQL database to the system (if you're using a dockerized version of Lemmy, the ports are only accessible by other docker containers in the same "docker network"). Be very careful to either firewall off the PostgreSQL port, or even better, make sure its only bound to
127.0.0.1as of course that database DOES have sensitive data in it.
Do not continue, nor pass "go", until you've read the above two notes!
Continuing on, you'll need to make sure that you can connect to your Lemmy PostgreSQL container from the system that this tool is running on. Assuming that you're using a docker-compose.yml file for your Lemmy stack, and that this tool is going to be running on the same system as the rest of your Lemmy containers, you can modify docker-compose.yml and look for the postgres section, and make the following modification:
postgres:
    image: postgres:15-alpine
    # this needs to match the database host in lemmy.hson
    hostname: postgres
    ports:
      - "127.0.0.1:5432:5432" # <-- This is the line you need, along with the "ports:" declaration right above this line
    #    ^ Last warning, do NOT forget to explicitly bind it to localhost unless you're dead-sure of the potential ramifications from skipping doing so!
    # You'll probably have things below this line, do not touch those lines and keep them as they are
    # ...etc
Now, you'll need to create a separate database user for this tool (you don't actually have to but I really really recommend making a separate one, as a general best practice) - this user will only be granted SELECT permissions, so that even if you or someone else were to change all of the queries in this tool from SELECT to DELETE it wouldn't have any effect - acting as a good enough safeguard. To do so, you'll need access to the psql CLI tool, which comes with the postgres container if you do not already have it installed elsewhere:
You have backed up your database, right? Please do not proceed with running any SQL commands until you've done so!
Run the following commands in the same folder as your docker-compose.yml file:
docker compose exec -it postgres /bin/bash
That will get you into the container, now to enter the postgres CLI:
psql -U lemmy
Now to create a new user called metrics (it can be whatever you'd like, but keep note of it somewhere, along with the password):
CREATE USER metrics WITH PASSWORD 'INSERT_A_SECURE_PASSWORD_HERE';
Next, grant it SELECT access to your lemmy database:
GRANT SELECT ON ALL TABLES IN SCHEMA public TO metrics;
Excellent! Now press Ctrl+d twice (the first time will exit the psql shell, and the second time will exit the postgres container's bash shell). Now, we're finally ready to start exporting the metrics!
Running
It took a minute to get here, apologies! I try to be incredibly thorough, while also being detailed so that you know exactly what you're doing. Those steps will only have to be done once though!
lemmy-data-exporter uses environmental variables to instruct it on the various details it needs to bridge the connection between your PostgreSQL database and Influx database.
One last disclaimer... I think. My instance is no where near the size of the major-league Lemmy instances. While I believe these queries should be fairly efficient, I'm not a professional DBA. What I'm saying is, when you run this tool, the time it takes to run is most likely dependent on the size of your instance. When I run this on the same machine that my instance is running on, it takes not even a full second to run. But its fine, because we have backups! Right...?
The environmental variables are as follows:
| Variable | Description | Example |
|---|---|---|
| PG_DB_HOST | The IP/hostname of your Lemmy postgres db | 127.0.0.1 |
| PG_DB_USER | The name of the user you created for this tool | metrics |
| PG_DB_PASS | The password of the user you created for this tool | hunter2 |
| PG_DB_NAME | The name of your lemmy database | lemmy |
| INFLUX_HOST | The IP/hostname of your Influx database | 127.0.0.1 |
| INFLUX_PORT | The port number of the HTTP API for Influx (its probably 8086) | 8086 |
| INFLUX_NAME | The name of the Influx database you created earlier | metrics |
At the current moment, all of these variables are required - if you miss one, the application will scream at you and walk out the door, leaving an error message in its wake.
To start the application, place all of your variables before the invocation of the command, example:
PG_DB_HOST=127.0.0.1 PG_DB_USER=metrics PG_DB_PASS=hunter2 PG_DB_NAME=lemmy INFLUX_HOST=127.0.0.1 INFLUX_PORT=8086 INFLUX_NAME=metrics ./lemmy-data-exporter
(Permission denied? Make the binary executable first: chmod +x lemmy-data-exporter)
If it worked, you'll get some output from the program, and then it'll exit as it only runs the operation once. We'll fix that in a moment!
Example Output:
Connecting to Postgres...
Found stats: LemmyStats {
    time: 2023-07-02T15:16:05.607633219Z,
    registered_users: 12, # This should be self explanatory, but its the total number of users registered on your instance
    verified_users: 12, # The amount of users who've verified their email address
    unverified_users: 0, # The amount of users who have NOT verified their email address
    approved_users: 12, # The amount of registered users who had their accounts approved
    unapproved_users: 0, # The amount of registered users who have NOT had their accounts approved
    num_of_apps: 0, # The current number of pending application/sign up requests (yes, "apps" was probably a bad name... oh well)
    denied_users: 0, # The amount of applicants who were denied
    known_communities: 92, # The amount of communities your instance knows about
    known_instances: 1533, # The amount of instances your instance knows about
    known_comments: 155645, # The amount of comments your instance knows about
    known_posts: 13166, # The amount of posts your instance knows about
    comments_from_local: 250, # The amount of comments users on YOUR instance have made (whether locally, or remotely)
    posts_from_local: 4, # The amount of posts users on YOUR instance have made (whether locally, or remotely)
    upvotes_from_local: 3950, # The amount of upvotes (posts+comments) users on YOUR instance have cast (whether locally, or remotely)
    downvotes_from_local: 40, # The amount of downvotes (posts+comments) users on YOUR instance have cast (whether locally, or remotely)
}
Wrote to Influx:
Done pushing Influx stats
Pushed stats to influx
Automation
I'd imagine that you're not going to want to sit there and continuously run that command, because I certainly don't! To make things easier and automatic, I've created a systemd service/timer that you can use to run this in the background. If you look at the files in the systemd folder, you'll want to go ahead and grab them, and do the following with them:
lemmy-data-exporter.service- This service unit assumes you have placed the
lemmy-data-exporterbinary in/usr/bin, if not, or its named differently, edit that line - If it looks correct, copy it to
/etc/systemd/system/
- This service unit assumes you have placed the
lemmy-data-exporter.timer- This timer unit assumes you want to run this tool every five minutes. You can increase or decrease the timer by adjusting it in the
OnCalendarline - Also copy this to
/etc/systemd/system/
- This timer unit assumes you want to run this tool every five minutes. You can increase or decrease the timer by adjusting it in the
config- This is the file that holds all of your environmental variables, so that the
ExecStartline isn't hideous. You need to edit these example values to the ones you used earlier during the test run. - Make the
/etc/lemmy-data-exporterdirectory, then copy this file there. If you want the directory/name changed, edit theEnvironmentFilestanza inlemmy-data-exporter.serviceto match.
- This is the file that holds all of your environmental variables, so that the
Now, once those are all copied over, run systemctl daemon-reload in order to make systemd aware of the new units. You can then give it a try by running systemctl start lemmy-data-exporter.service, if it returns without an error then it most likely worked but you can verify by running systemctl status lemmy-data-exporter.service (it is normal for the "Active" state to say "inactive (dead)" since its being triggered by the timer, and isn't a long-living process). Assuming that went well, enable the timer (so that it runs automatically) with systemctl enable lemmy-data-exporter.timer.
Both units have been set so that if for whatever reason docker.service isn't running (such as it crashed, or you explicitly stopped it) then the timer/service should automatically stop as well. Congrats, the hard part is over!
Now what?
Now that we've gotten some metrics out of the Lemmy database and into an Influx database, we can visualize it using a tool such as Grafana! I've also taken the liberty of exporting the Grafana dashboard I built into the grafana folder. If you didn't see the preview earlier, you can find a preview version of the dashboard over here.
Installing Grafana is also out of scope for this README, but once you do have Grafana installed, go to the bottom left and click Settings -> Data Sources, then Add Data Source.
Make sure to select InfluxDB as your source type, and then from there fill in the details of your InfluxDB that you setup earlier (I'm not sure if the data source name impacts whether the dashboard import works, I named mine InfluxLemmy). Note, if you're running Grafana on a server that is different from the InfluxDB server, it will need a connection to Influx in order to actually read the data. You could do this with a firewall exception, a Wireguard tunnel, etc. Once the details are entered in, click Save & test at the bottom and it should confirm that your data source was added that Grafana could connect to it.
Then go to the left sidebar, and click Dashboards (the four squares almost Windows-logo-looking icon) -> Import, from there you can then either save the JSON file from GitHub onto your computer, or just copy it from file viewer and paste it into the Import via panel json textbox.
The end result, should look something like this if all went well!
Wrapping up
Thanks for taking a look at my project! Hopefully it can help others! If you have any questions, please don't hesitate to reach out to me either via Matrix or just opening an issue here.
How can I contribute?
There's a few ways you can contribute!
- Great at SQL? I mentioned that I'm not a DBA, if you have any recommendations on how I can make the SQL queries I use in
src/main.rsany better, I'd be happy to implement those changes! Or even, if you have new queries that would work well integrated here, that's great too! - Great at Rust? I mentioned that I'm incredibly new to Rust, so if there is something I could've done to make this more Rust-y, please certainly let me know so I can get better at Rust!
- Great at making Grafana dashboards? My creative/artistic flare has never been my strong suit. If you make a dashboard that you don't mind others potentially using, certainly feel free to export it and submit as a PR to the
grafanafolder! If you do, just please try to make sure to generate a snapshot link or at least include some screenshots just so that others know what to expect! - Great at documentation? There's always the potential that I've missed something here, I've been working on this straight right after a long work shift, and while I try to be thorough, a fresh pair of eyes never hurt!
- Great at encouragement? Everyone could always use some encouragement, provide someone with some aspirational words of encouragement, whether thats to me or to someone else!
- Spread the word! I don't actually mean about this project, though I won't stop you from doing so! I meant to spread the word about Lemmy and the Fediverse! If you or someone else needs an instance to join, my instance has open registrations (though for spam prevention, approval is required - you just need to verify you're human) or there are also tons of instances out there even if you don't want to join mine. I only ask that you try to take a look into some of the smaller instances, as the larger instances are very likely having growing pains at the time of writing, and also the Fediverse does better when everyone is distributed across a variety of instances.
 16 Oct 9, 2022
 315 Apr 10, 2023

 4.6k Jan 1, 2023
 22 Mar 27, 2023
 11 Apr 4, 2023
 4 Feb 16, 2024
 16 Oct 10, 2022

 34 Dec 27, 2022


 30 Dec 22, 2022
 6 Feb 17, 2023
 21 Oct 29, 2022
 117 Jan 3, 2023
 51 Jul 4, 2023
 7 Sep 11, 2023
 3 Nov 8, 2023
 1 Dec 20, 2022
 7.5k Jan 1, 2023
 629 Jun 14, 2023